

Build a Cryptocurrency Charts App That Reveals Every Pattern on the Tape with AI
Create your cryptocurrency charts app in minutes with AI. Power candlestick rendering, technical indicators, drawing tools, and timeframe switching without coding.










Why Emergent for Cryptocurrency Charts Apps?
Flat price lines hide the structure traders need to read. On Emergent, describe what you need and it builds your cryptocurrency charts app.
| Traditional Builders |  |
|
|---|---|---|
| Creation & Setup | Limited templates with lengthy setup and multiple manual steps | Fully customizable cryptocurrency charts app created instantly using plain English prompts |
| Design | Limited design flexibility | AI-driven, personalized design layouts that match your brand |
| Chart Logic | No candlestick or indicator engine | Render candles and indicators natively using prompts |
| Custom Domain | Requires purchasing a domain and manual DNS configuration setup | Just share your domain. We handle DNS setup with SSL included |
| Time to Launch | Can take up to days and weeks | Launch in just a few minutes to hours |
| Payment & Checkout | Limited plugins and integrations | Accept global payments in any currency by connecting gateways with API keys |
| Drawing Tools | No way to mark up the chart | Draw trendlines and zones on the chart using prompts |
| SEO | Basic tools with heavy manual effort | Improve SEO instantly using prompts. No technical setup needed |
| Scaling | Limited scalability with performance constraints and risk of data loss | Scale your app anytime by reopening the chat and expanding with prompts |
| Maintenance & Updates | Requires manual updates, bug fixes, and ongoing management | Easily update and improve your app anytime using simple prompts |

Where a Cryptocurrency Charts App Pays Off
Structure that shows on the tape clearly
Fast, crisp candles render each move without lag, so patterns and rejections read at a glance instead of guesswork.

Confirmation for every position
Studies overlay right on the price, so entries rest on momentum evidence rather than a bare eyeball.
Levels that stay marked and visible
Trendlines and zones drawn on the chart persist across sessions, so a plan built once keeps working.
Intervals that align the whole read
Instant interval switching lets traders confirm across scales, so single-frame illusions stop generating losing entries.
How Emergent Turns Your Idea Into an App
Create a cryptocurrency charts app that manages candlestick rendering, technical indicators, drawing tools, timeframe switching, and charting operations from one platform.





Reveal Every Pattern on the Tape
Render the market in full detail so the tape, overlays, and notes make the structure obvious across any timeframe you choose.
End-to-end app development for your business
Turn ideas and spreadsheets into fully functional internal apps your team can actually use, not just plan on paper.
 Describe, don’t code:Write what you need in plain language and instantly generate the layout, components, and logic.
- Full UI in one go:Create full pages with forms, tables, filters, and charts in a single automated pass.
- Use the data you already have:Connect your spreadsheets or datasets quickly and turn them into interactive dashboards.
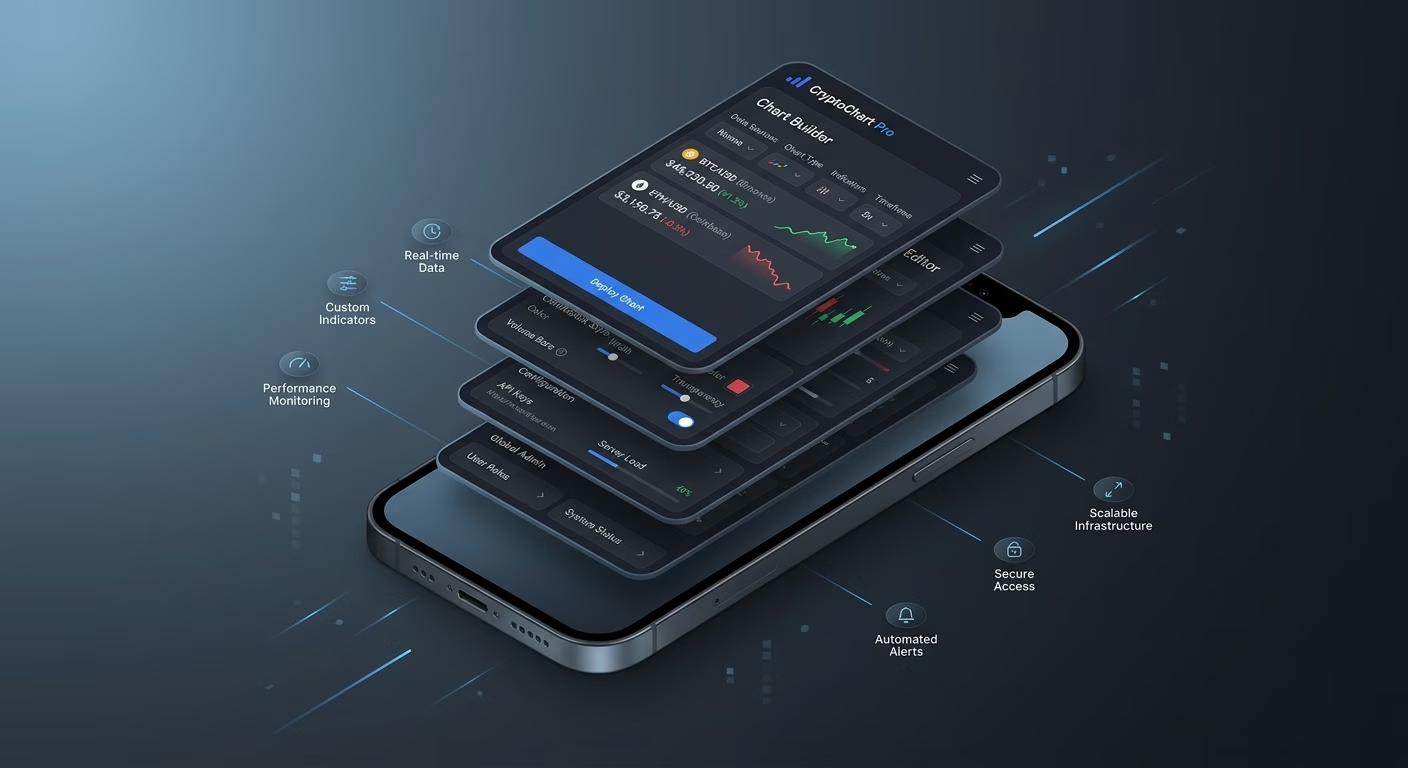
Candles rendered crisp and fast
Laggy charts hide moves. Rendering infrastructure draws each candle cleanly and quickly so price action reads clearly even on fast markets.
- Smooth candle drawing
- Volume bars
- Zoom and pan
- Crosshair readout
End-to-end app development for your business
Turn ideas and spreadsheets into fully functional internal apps your team can actually use, not just plan on paper.
- Describe, don’t code:Write what you need in plain language and instantly generate the layout, components, and logic.
- Full UI in one go:Create full pages with forms, tables, filters, and charts in a single automated pass.
- Use the data you already have:Connect your spreadsheets or datasets quickly and turn them into interactive dashboards.
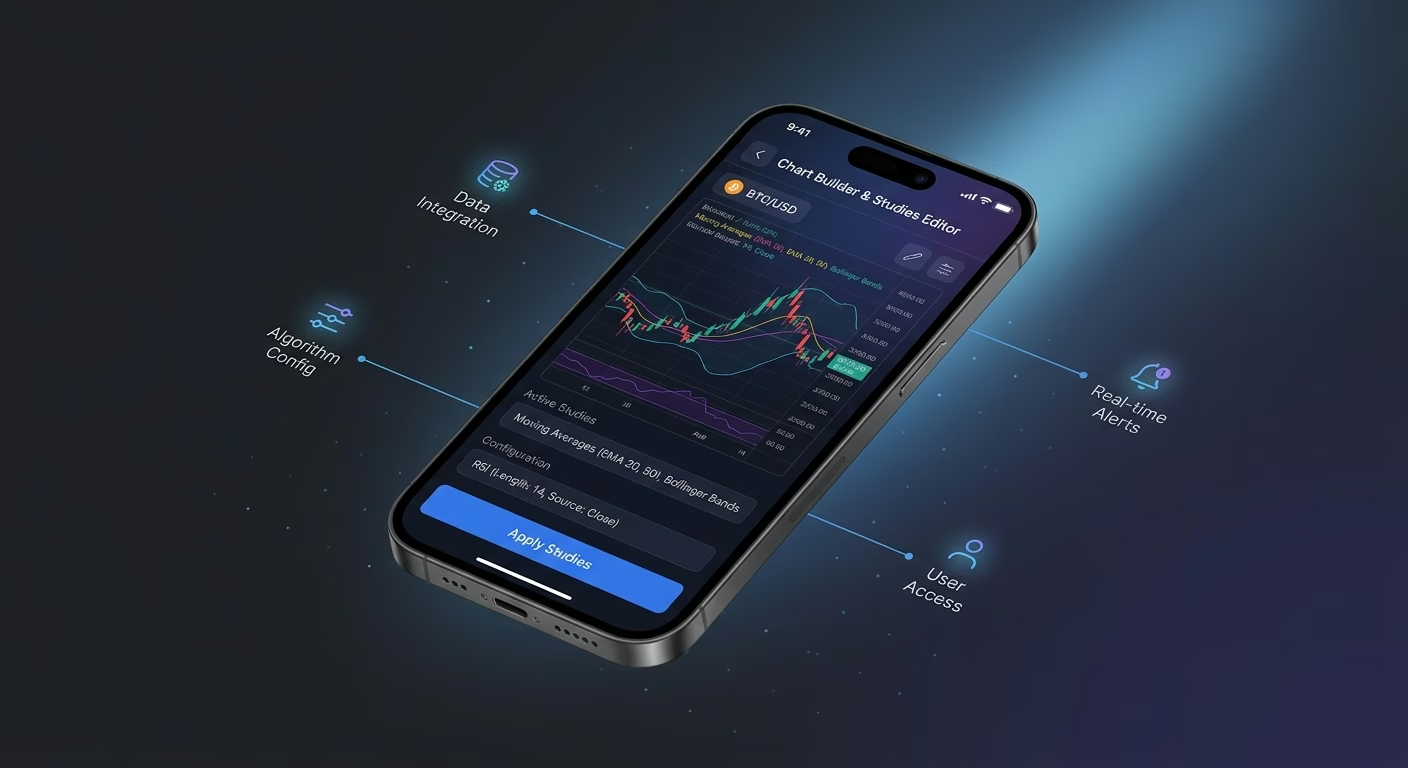
Studies overlaid on the price
Bare charts lack context. Indicator infrastructure layers moving averages and oscillators so the trader sees momentum and trend beside the price.
- Moving averages
- Oscillator suite
- Custom parameters
- Multi-pane layout
End-to-end app development for your business
Turn ideas and spreadsheets into fully functional internal apps your team can actually use, not just plan on paper.
- Describe, don’t code:Write what you need in plain language and instantly generate the layout, components, and logic.
- Full UI in one go:Create full pages with forms, tables, filters, and charts in a single automated pass.
- Use the data you already have:Connect your spreadsheets or datasets quickly and turn them into interactive dashboards.
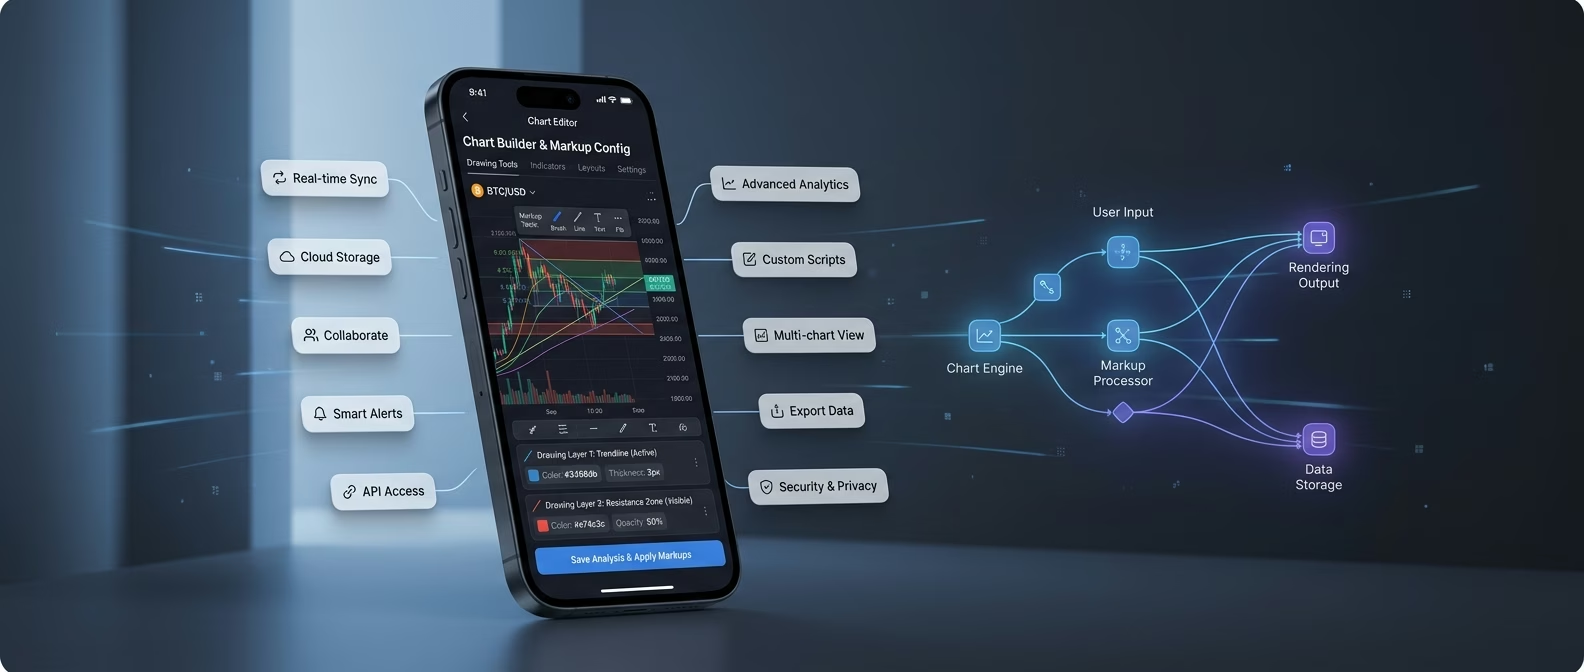
Markups drawn right on the chart
Mental levels get lost. Drawing infrastructure lets the trader place trendlines and zones on the chart so key levels stay visible and persistent.
- Trendline tools
- Support and resistance zones
- Fibonacci sets
- Saved drawings
End-to-end app development for your business
Turn ideas and spreadsheets into fully functional internal apps your team can actually use, not just plan on paper.
- Describe, don’t code:Write what you need in plain language and instantly generate the layout, components, and logic.
- Full UI in one go:Create full pages with forms, tables, filters, and charts in a single automated pass.
- Use the data you already have:Connect your spreadsheets or datasets quickly and turn them into interactive dashboards.
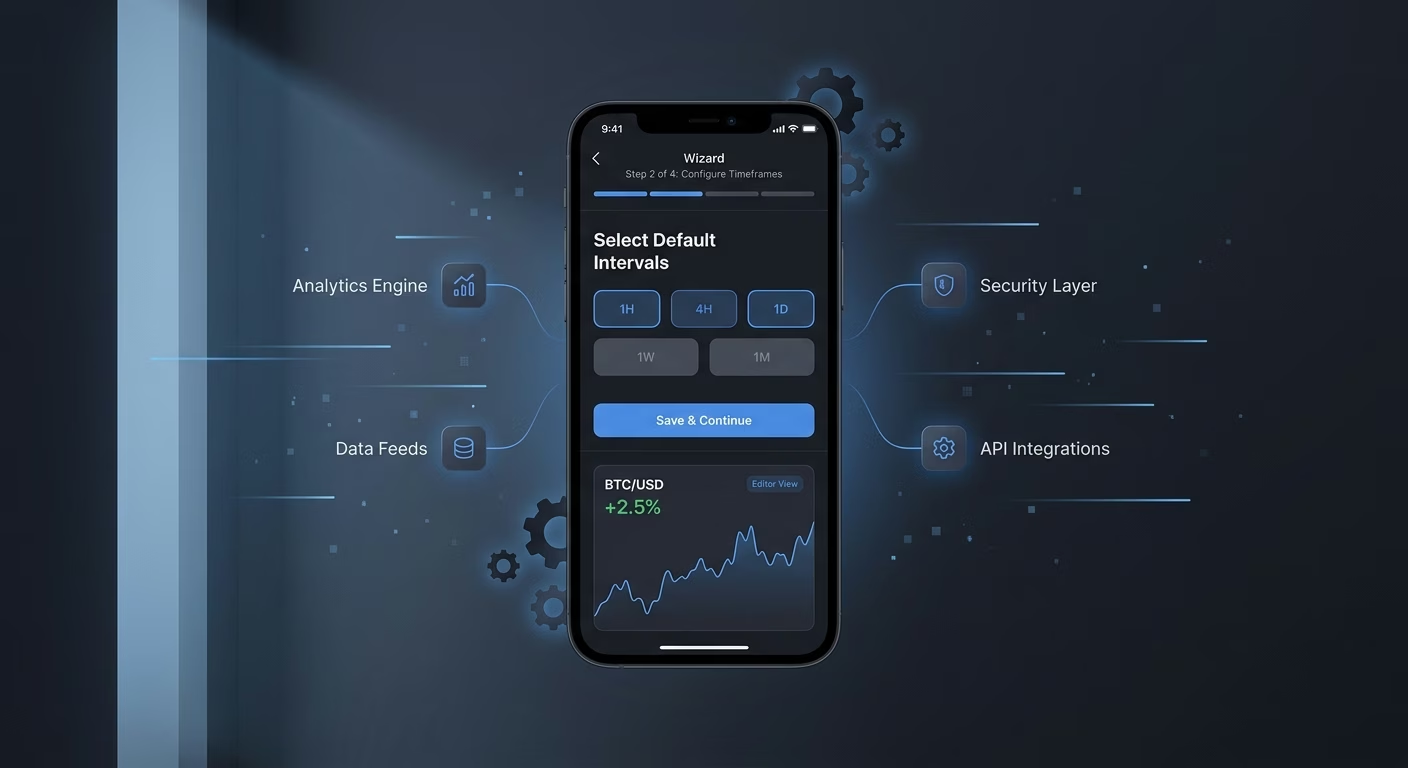
Timeframes switched in a tap
Single-frame views deceive. Timeframe infrastructure shifts between intervals instantly so the trader confirms a move across the scales that matter.
- Interval switching
- Multi-timeframe view
- Synced drawings
- Quick presets
Connect Your Charting Stack
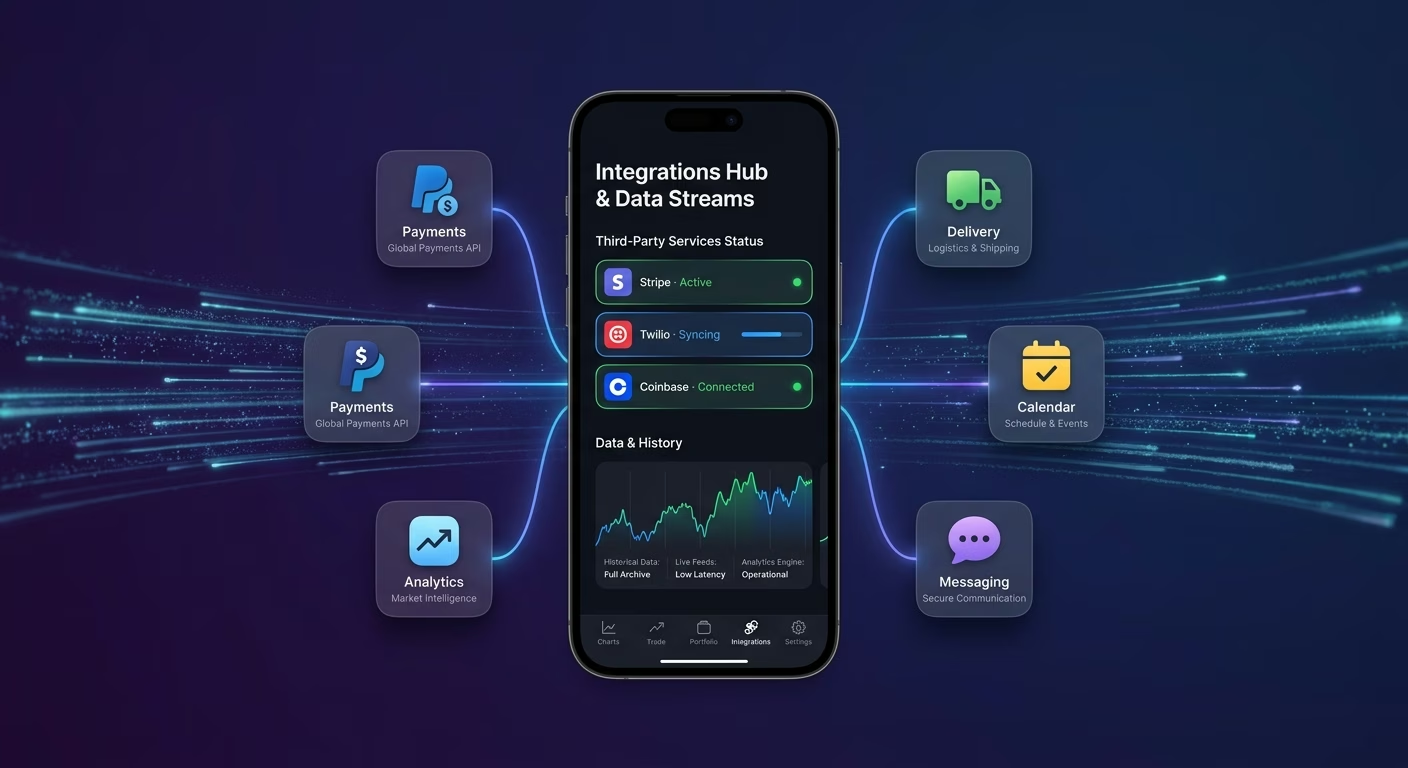
Data & History
Coordinate price history, tick data, and feeds across one workspace
- Price history archives
- Tick data feeds
- Market data providers
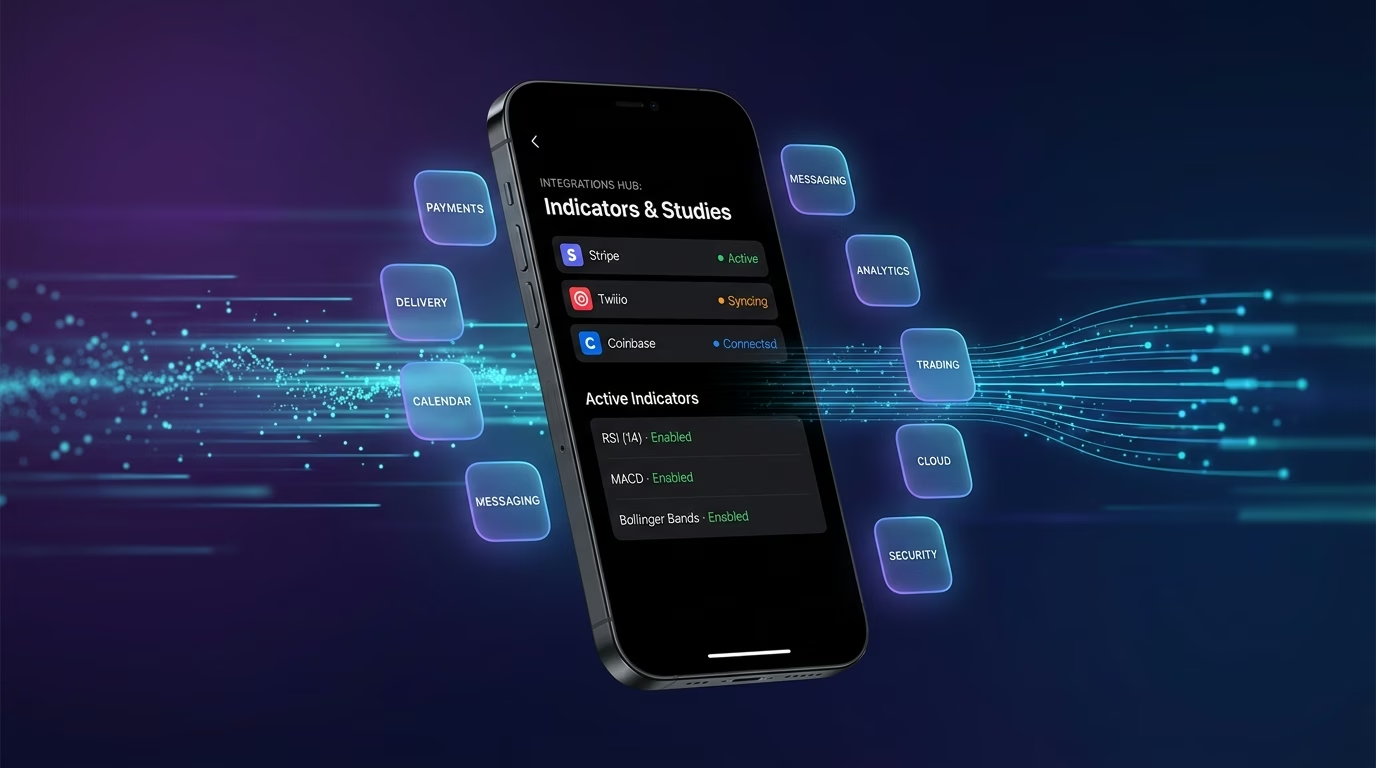
Indicators & Studies
Sync indicator libraries and study presets across every rendered chart
- Indicator libraries
- Study preset tools
- Backtest data systems
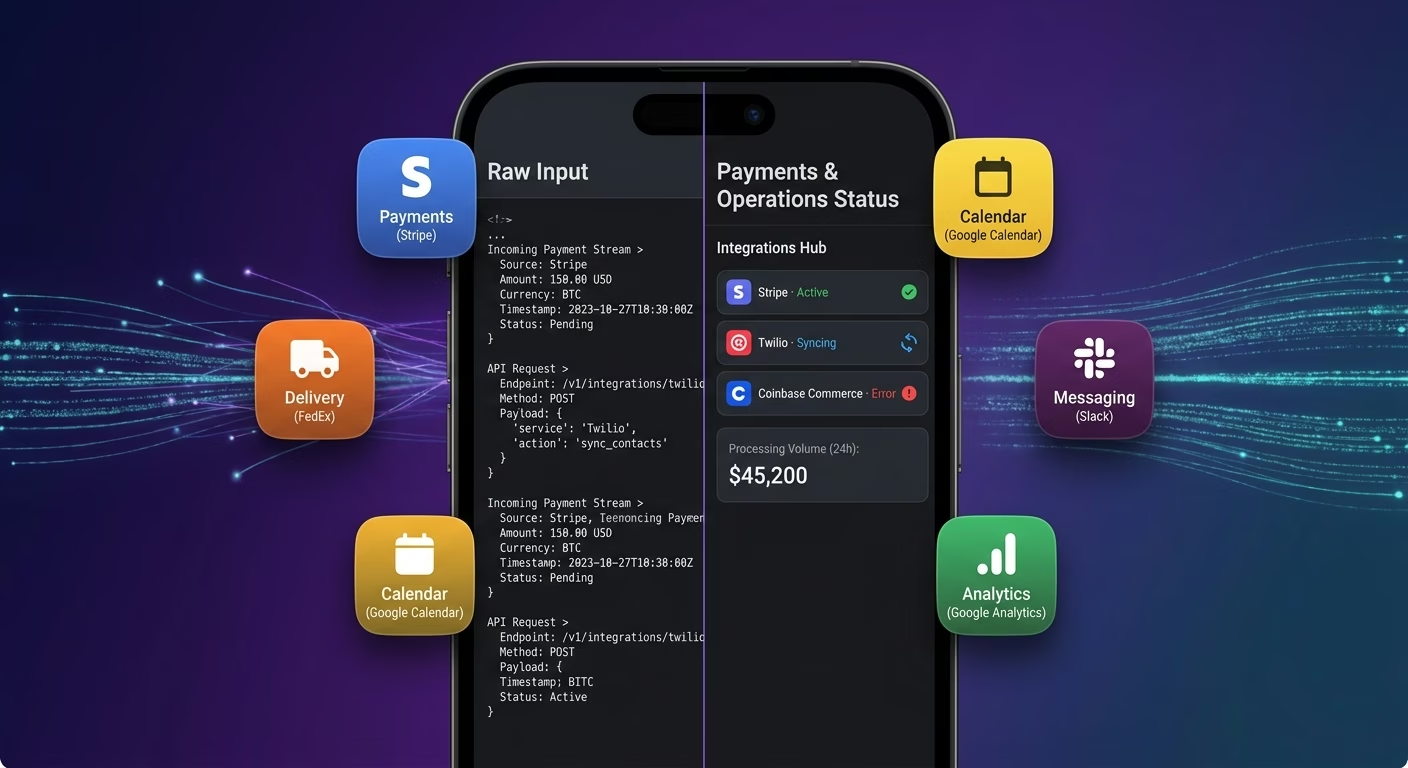
Payments & Operations
Connect Stripe, PayPal or Razorpay and operational tools through APIs
- Payment infrastructure
- Subscription tools
- Charting operations systems
Candles And Indicators, Connected
Reading breaks when candle data, indicator overlays, and saved drawings scatter across disconnected tools, so Emergent connects external systems through APIs and everything aligns as the charts grow.

How to Create a Cryptocurrency Charts App
Create a cryptocurrency charts app that manages candlestick rendering, technical indicators, drawing tools, timeframe switching, and charting operations from one platform.
01 Choose the right app building approach
You can hire a developer, use a traditional app builder, or use an AI-powered platform like Emergent. AI app builders help traders and analysts launch and manage charting apps without technical complexity or extended development timelines.
02 Plan your candle and indicator workflows
Decide how candles should render, how indicators should overlay, how drawings should mark up, how timeframes should switch, and how users should review before building.
03 Build your cryptocurrency charts app
Describe your chart types, indicator sets, drawing tools, and timeframe options, and the app is generated around your actual charting workflows.
04 Add candle systems and indicator workflows
Set up candlestick rendering, technical indicators, drawing tools, and timeframe switching so every pattern on the tape becomes visible.
05 Connect payments and operational tools
Connect payment gateways like Stripe, PayPal, or Razorpay alongside price history archives, indicator libraries, market data providers, and notification infrastructure to support charting operations. On Emergent, these systems can be connected easily through APIs.
06 Test the app before publishing
Check candlestick rendering, technical indicators, drawing tools, timeframe switching, mobile performance, and user experience before launch.
07 Publish and grow your cryptocurrency charts app
Launch the app and continue managing candles, indicators, and drawings as the charts grow.
Turn Flat Prices Into Readable Structure
Traders who read candles, overlay indicators, and mark up the chart spot setups others miss while a flat price line hides the structure that turns a guess into a plan.
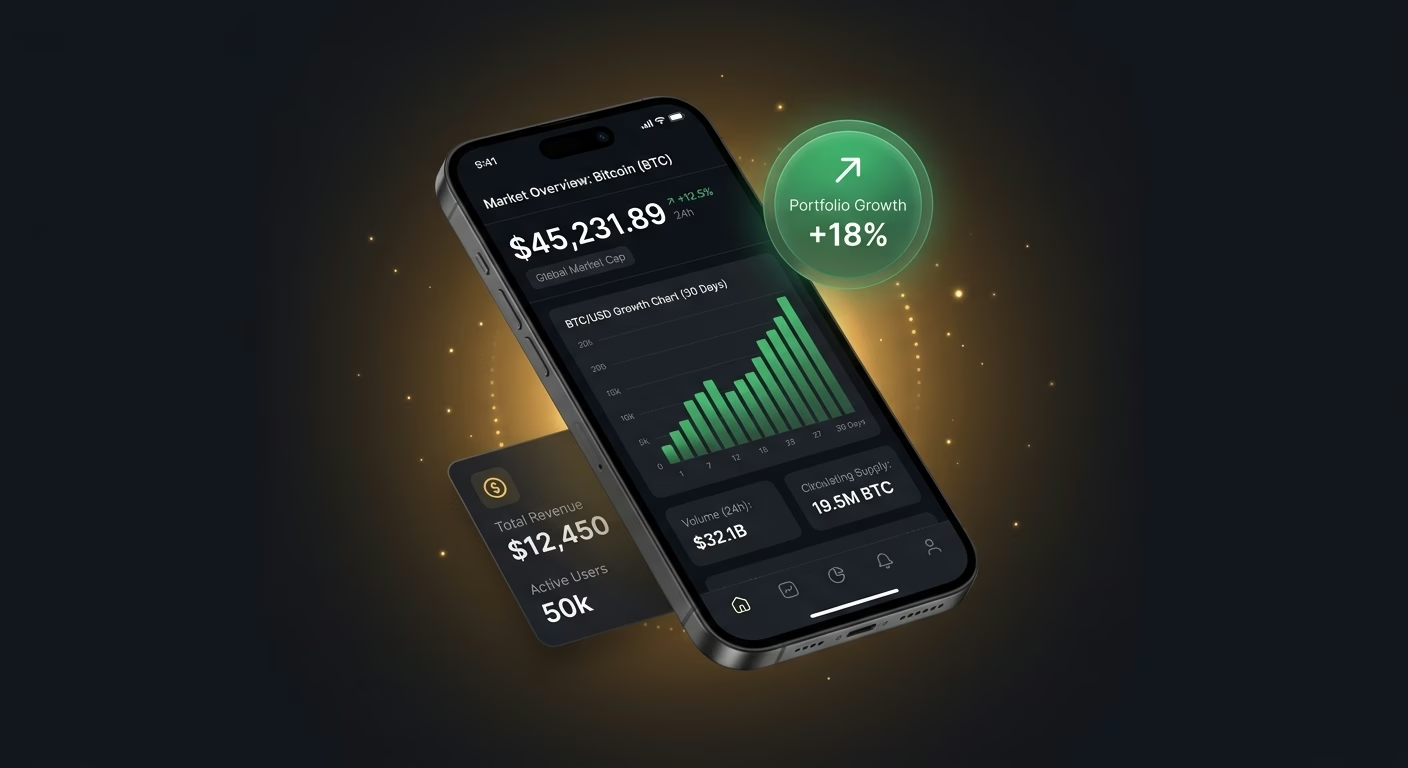
Clear bars expose the market behavior
A flat line shows only where price is, not how it got there, and the app that renders crisp candles reveals the highs, lows, and rejections that tell the trader what the market is doing.
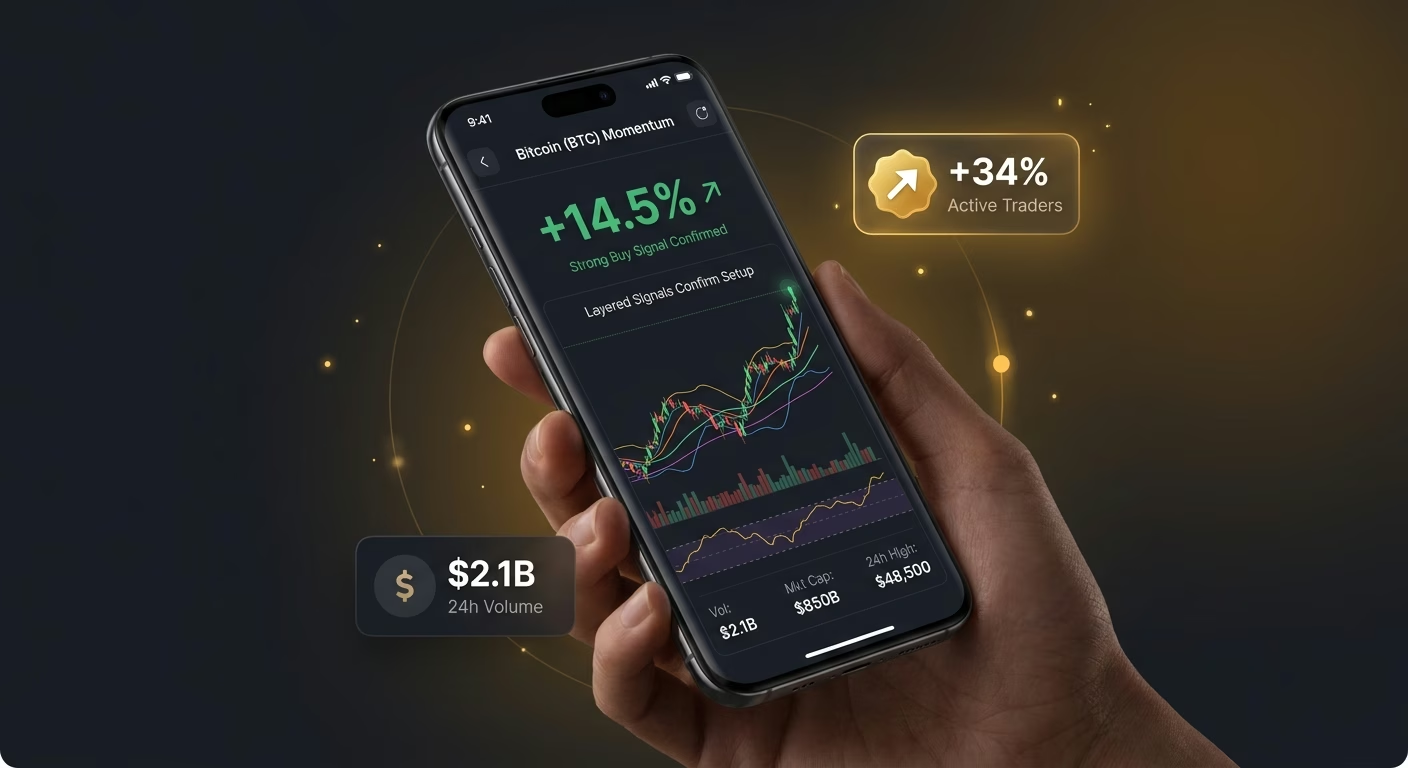
Layered signals confirm the setup
A pattern eyeballed without confirmation invites a bad entry, and the app that overlays the right studies lets the trader validate a setup before committing real capital to it.
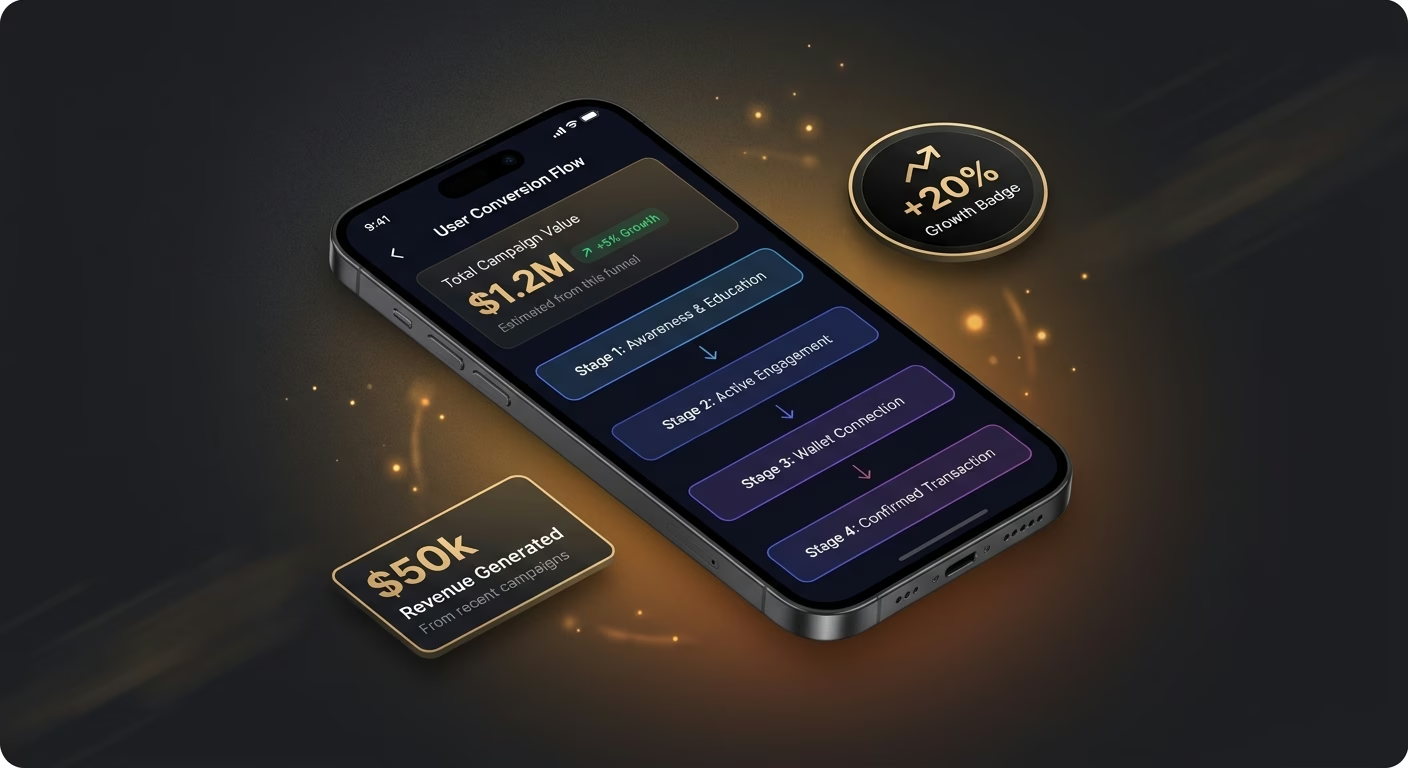
On-tape drawing turns reading into a plan
A level held only in the trader's head gets forgotten under pressure, and the app that lets them draw zones and trendlines turns loose observation into a concrete, visible trading plan.
Pick the Pricing Plan That Works for You
Choose the plan that fits your building ambitions. From weekend projects to enterprise applications, we've got you covered.




Find the Right App Builder
for Your Business
Frequently Asked Questions
Your Questions, Answered
Don't change this element unless you know what you are doing
on Emergent today




