


The AI Dashboard Builder That Ships Real Dashboards
Build your dashboard with Emergent, the AI dashboard builder that ships real, working dashboards. Get charts, live data, and backend from a prompt. No code.





Build, customize, and update your dashboard with ease
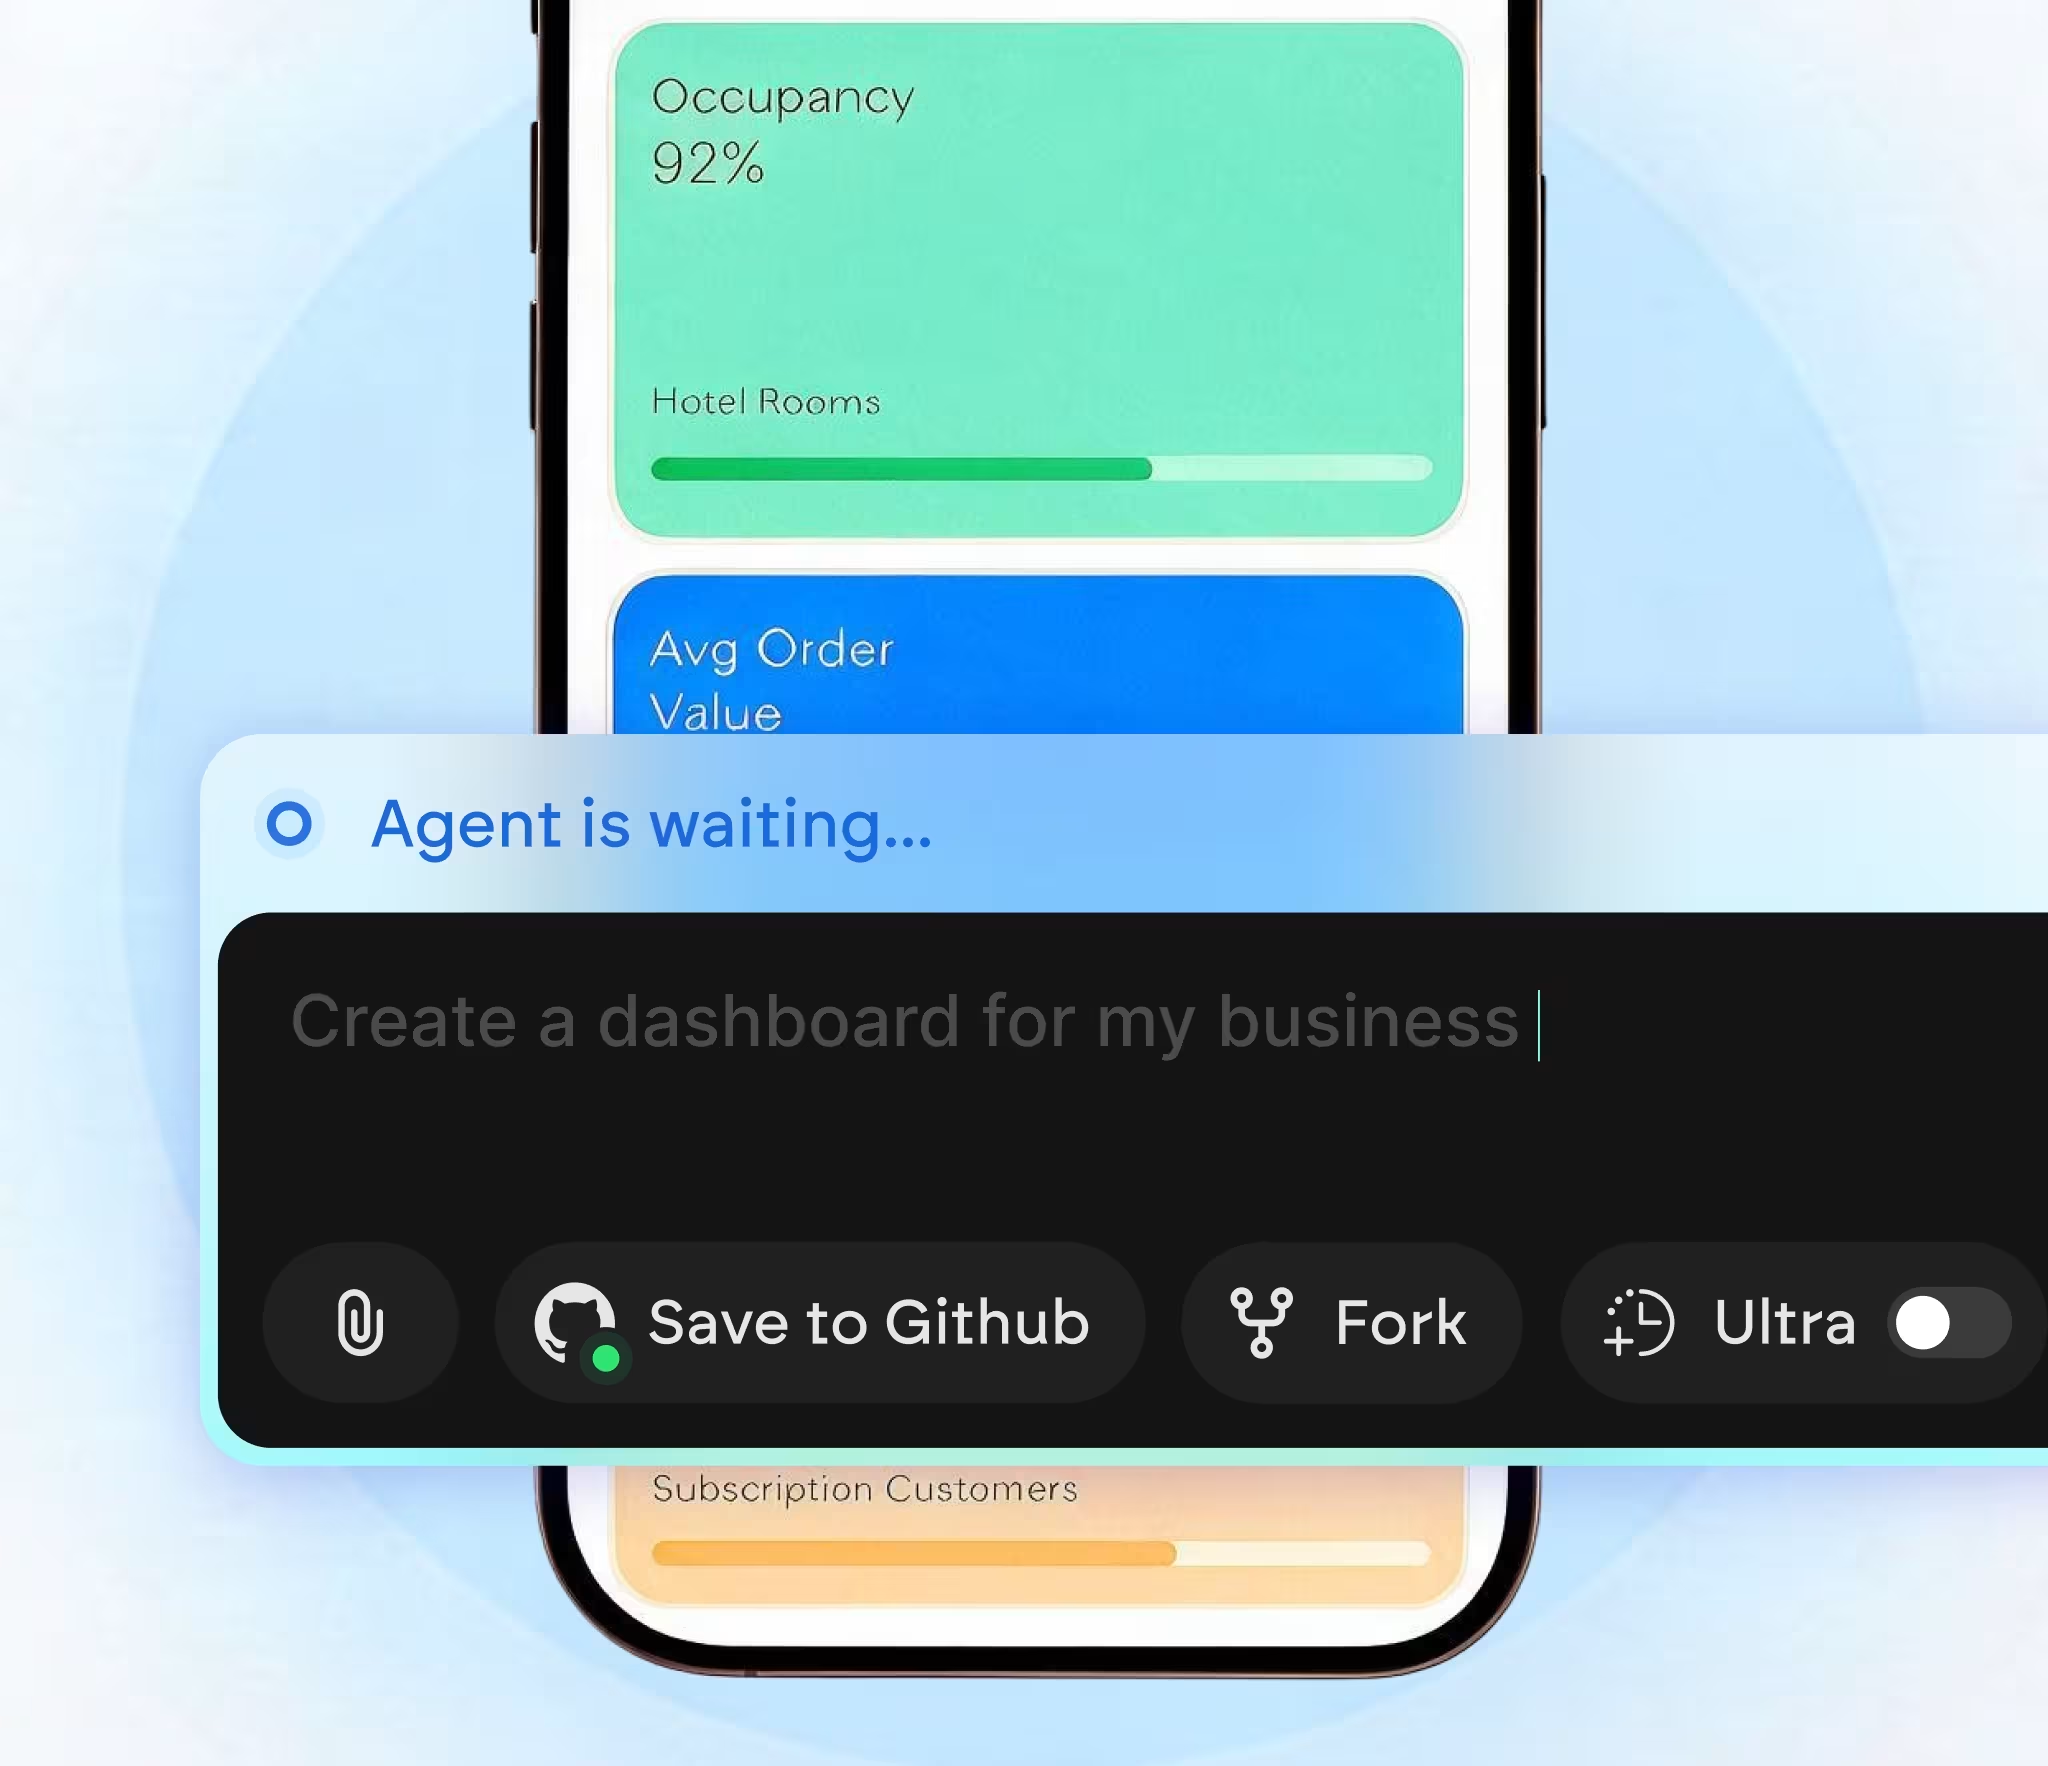
A Dashboard That Fits Your Business
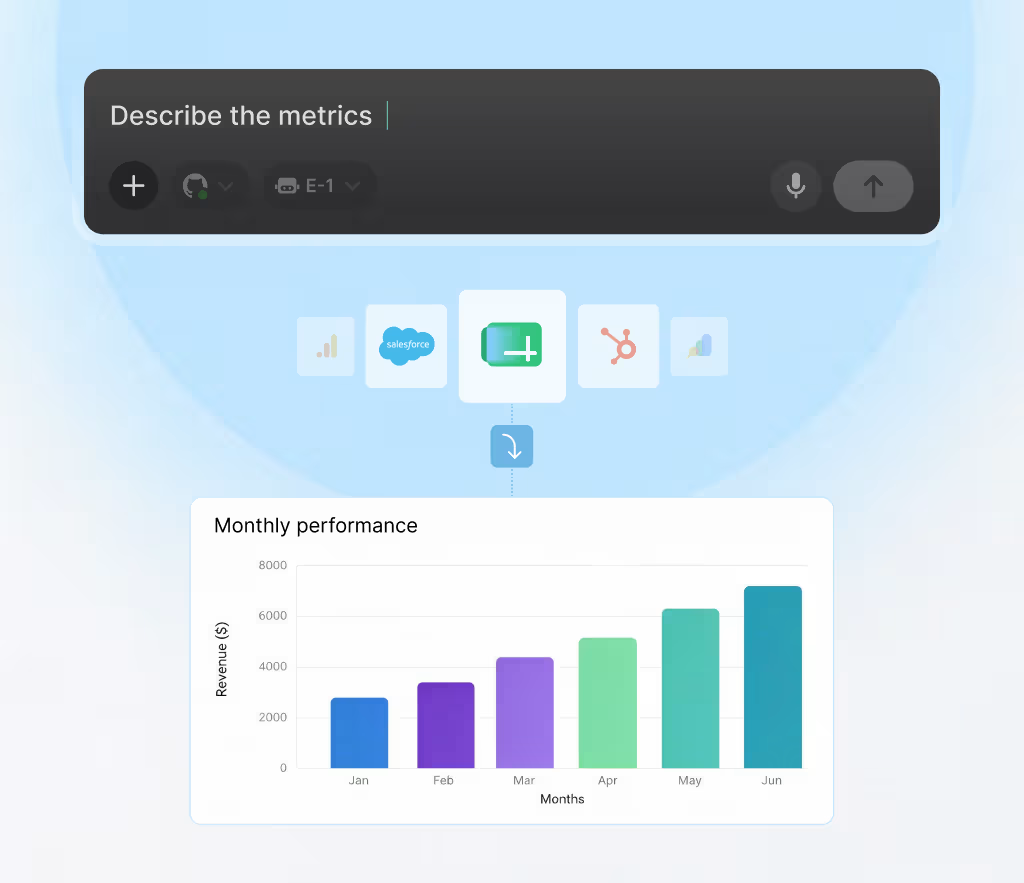
Go From Data to Dashboard in Minutes
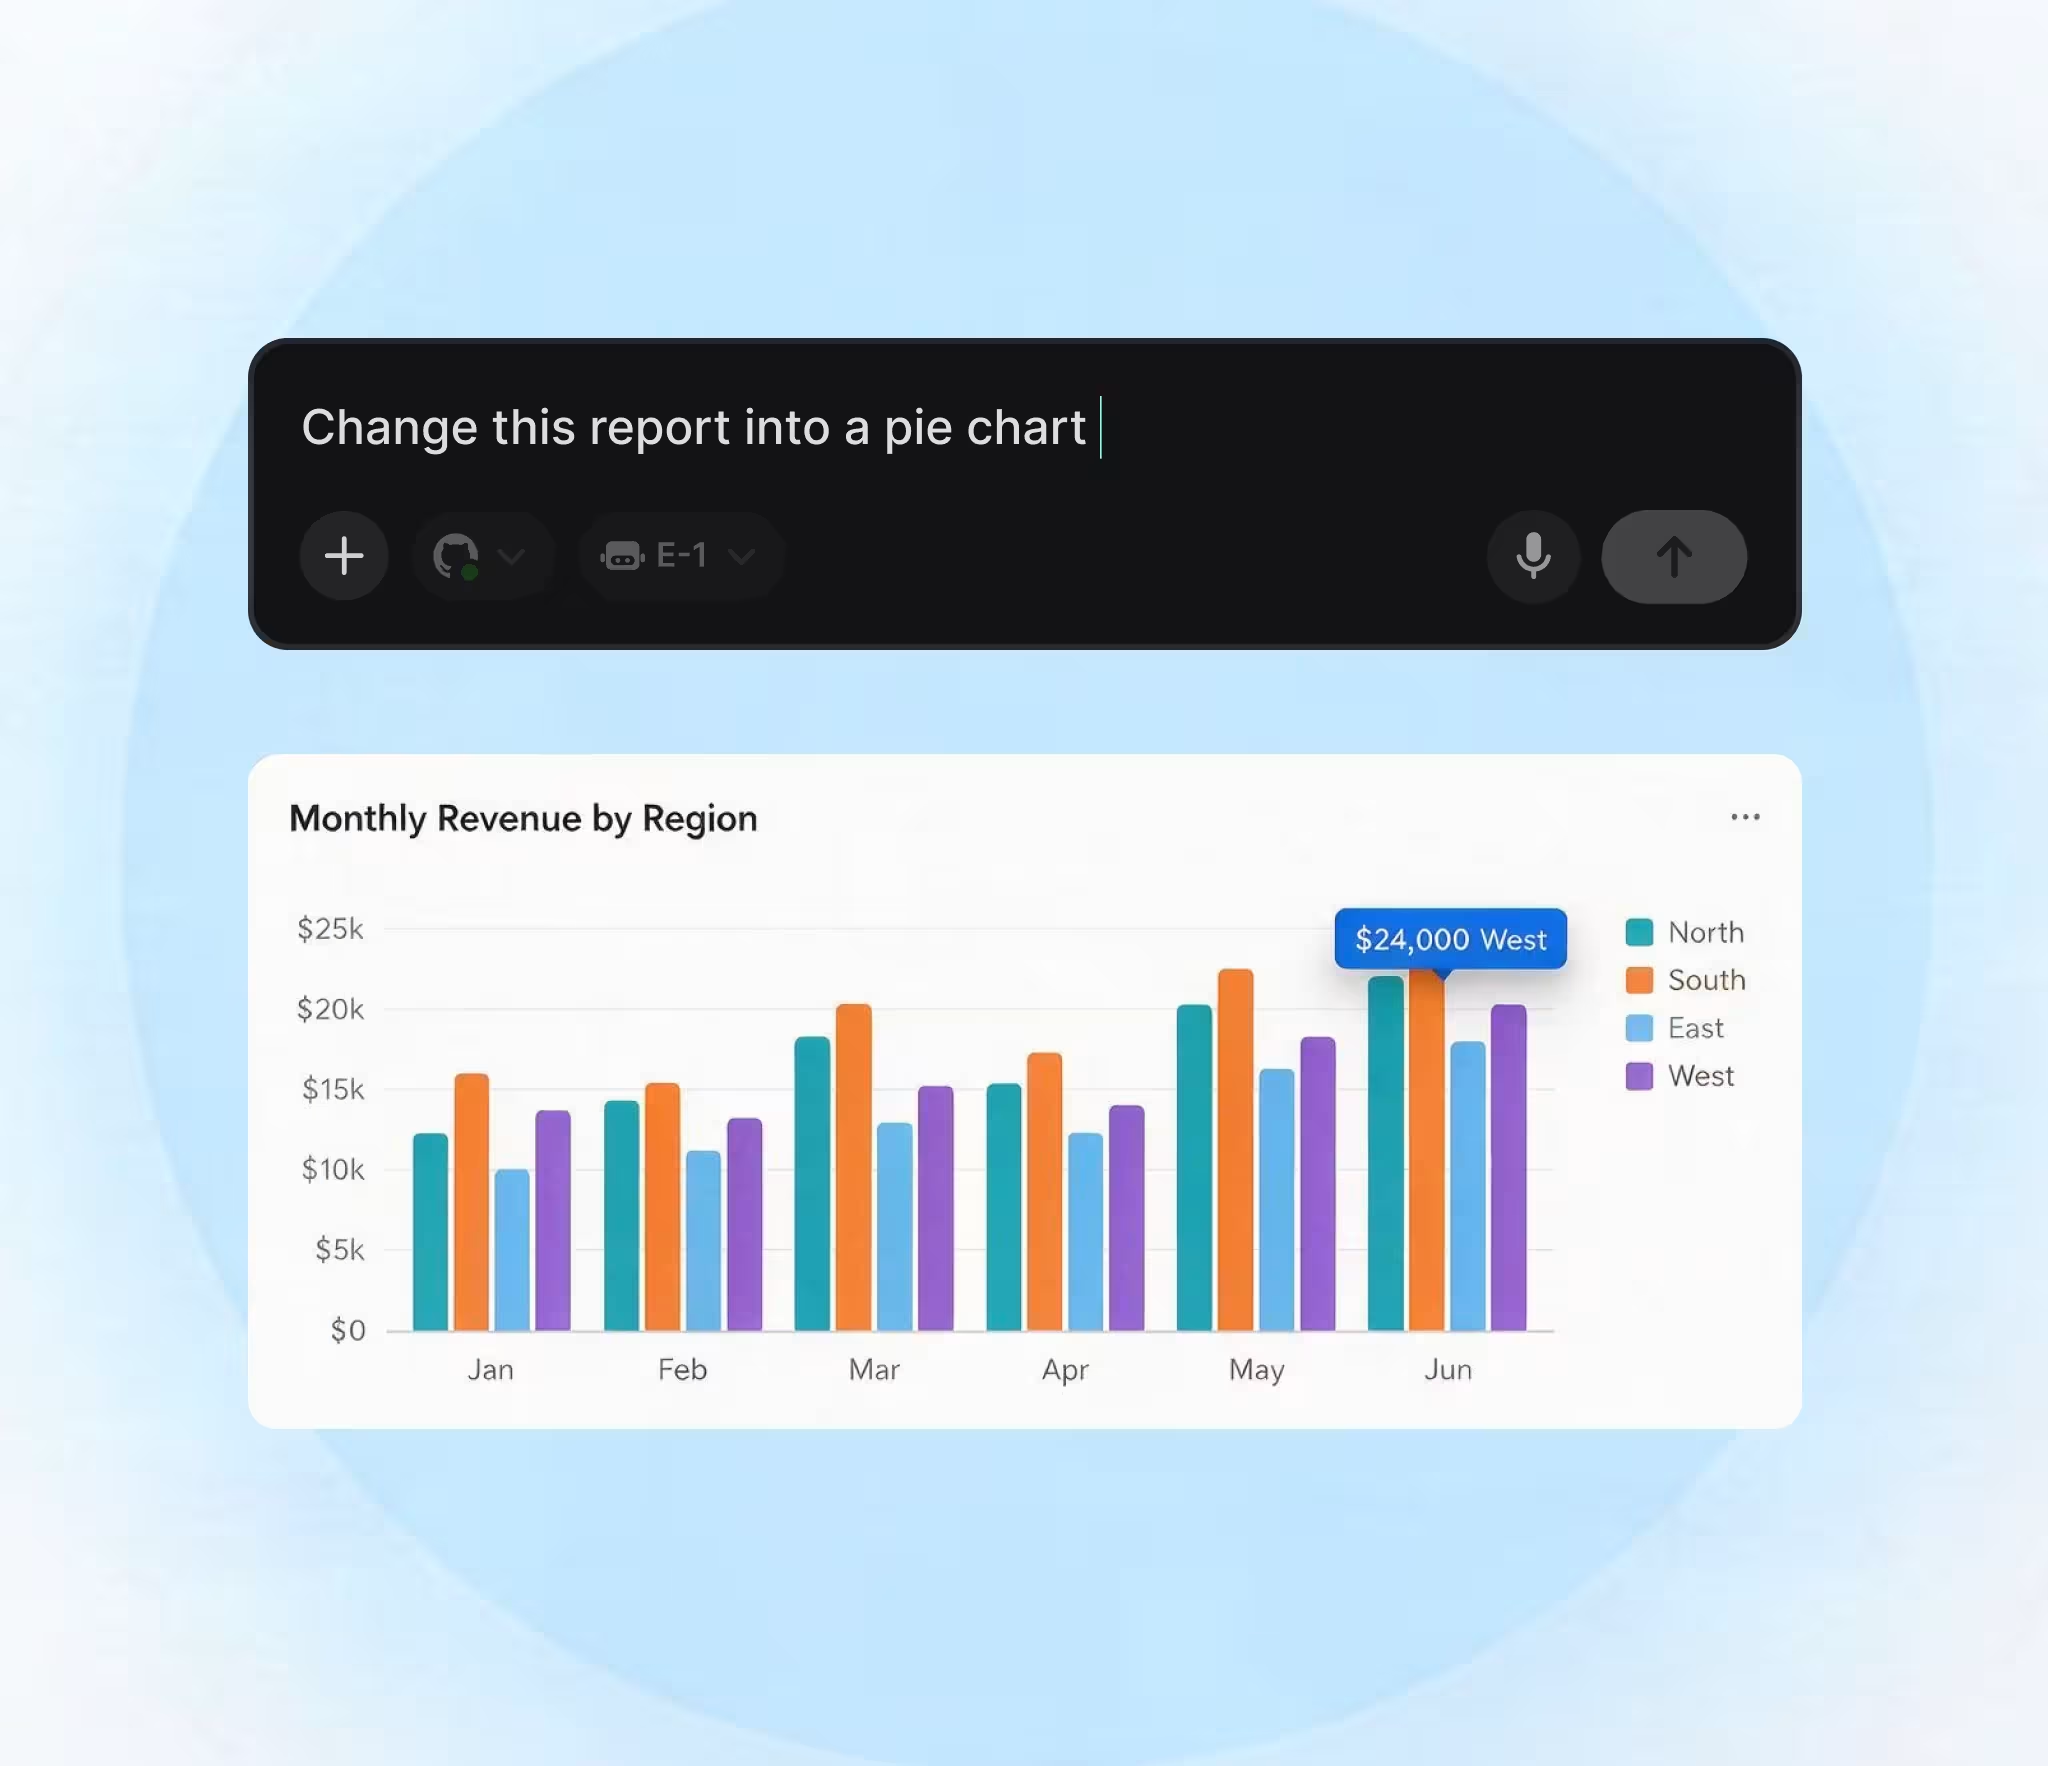
Teams With Limited Non Technical Skills

Emergent Key Features for Building a Dashboard
From charts to data to access controls, every layer of your dashboard is handled in one place. Just describe what you need.
Turn your idea into a website. Launch instantly.
Describe your website in plain language and Emergent builds it from the ground up. No templates, no setup, no waiting.
 Describe, don’t code:Write what you need in plain language and instantly generate the layout, components, and logic.
- Full UI in one go:Create full pages with forms, tables, filters, and charts in a single automated pass.
- Use the data you already have:Connect your spreadsheets or datasets quickly and turn them into interactive dashboards.
Visualize anything the way it makes sense.
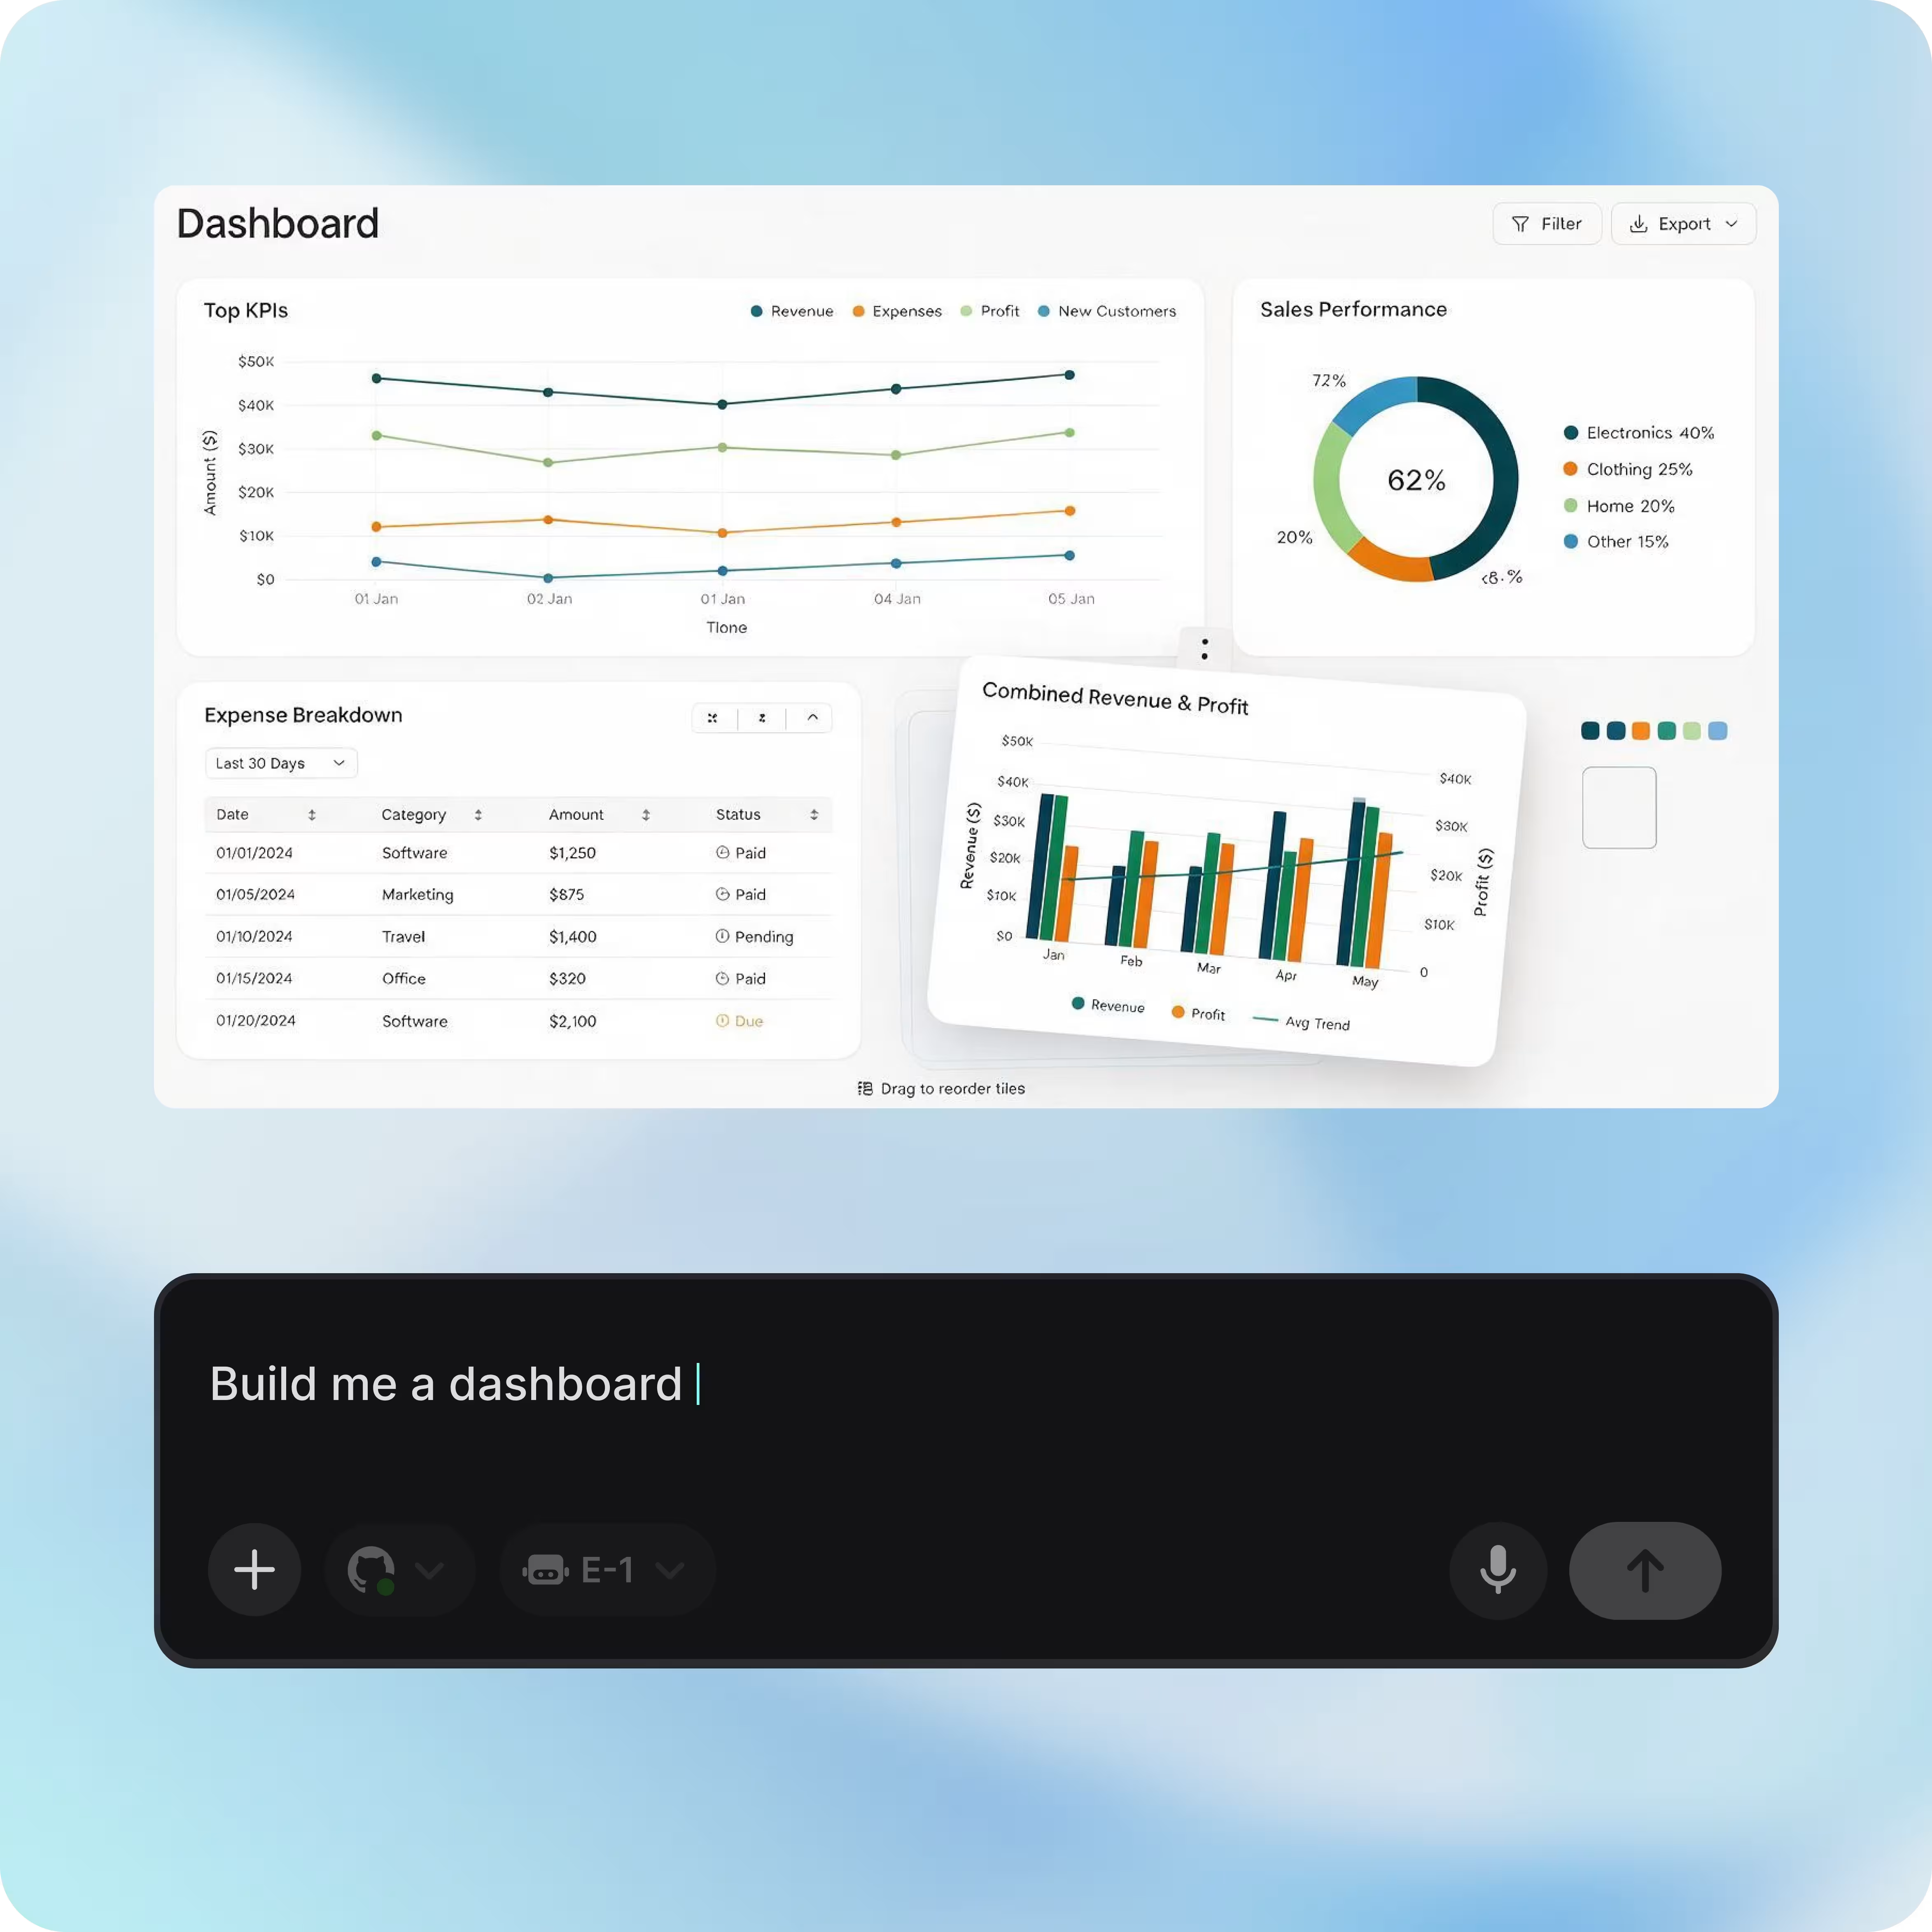
Describe the dashboard you want and Emergent builds the charts, tables, and layout to match, then shapes the look to fit your brand.
- Line, bar, pie, and combo charts
- Sortable tables, filters, and date ranges
- Drill-downs from summary to detail
- Adjust colors, layout, and branding by prompting
Turn your idea into a website. Launch instantly.
Describe your website in plain language and Emergent builds it from the ground up. No templates, no setup, no waiting.
- Describe, don’t code:Write what you need in plain language and instantly generate the layout, components, and logic.
- Full UI in one go:Create full pages with forms, tables, filters, and charts in a single automated pass.
- Use the data you already have:Connect your spreadsheets or datasets quickly and turn them into interactive dashboards.
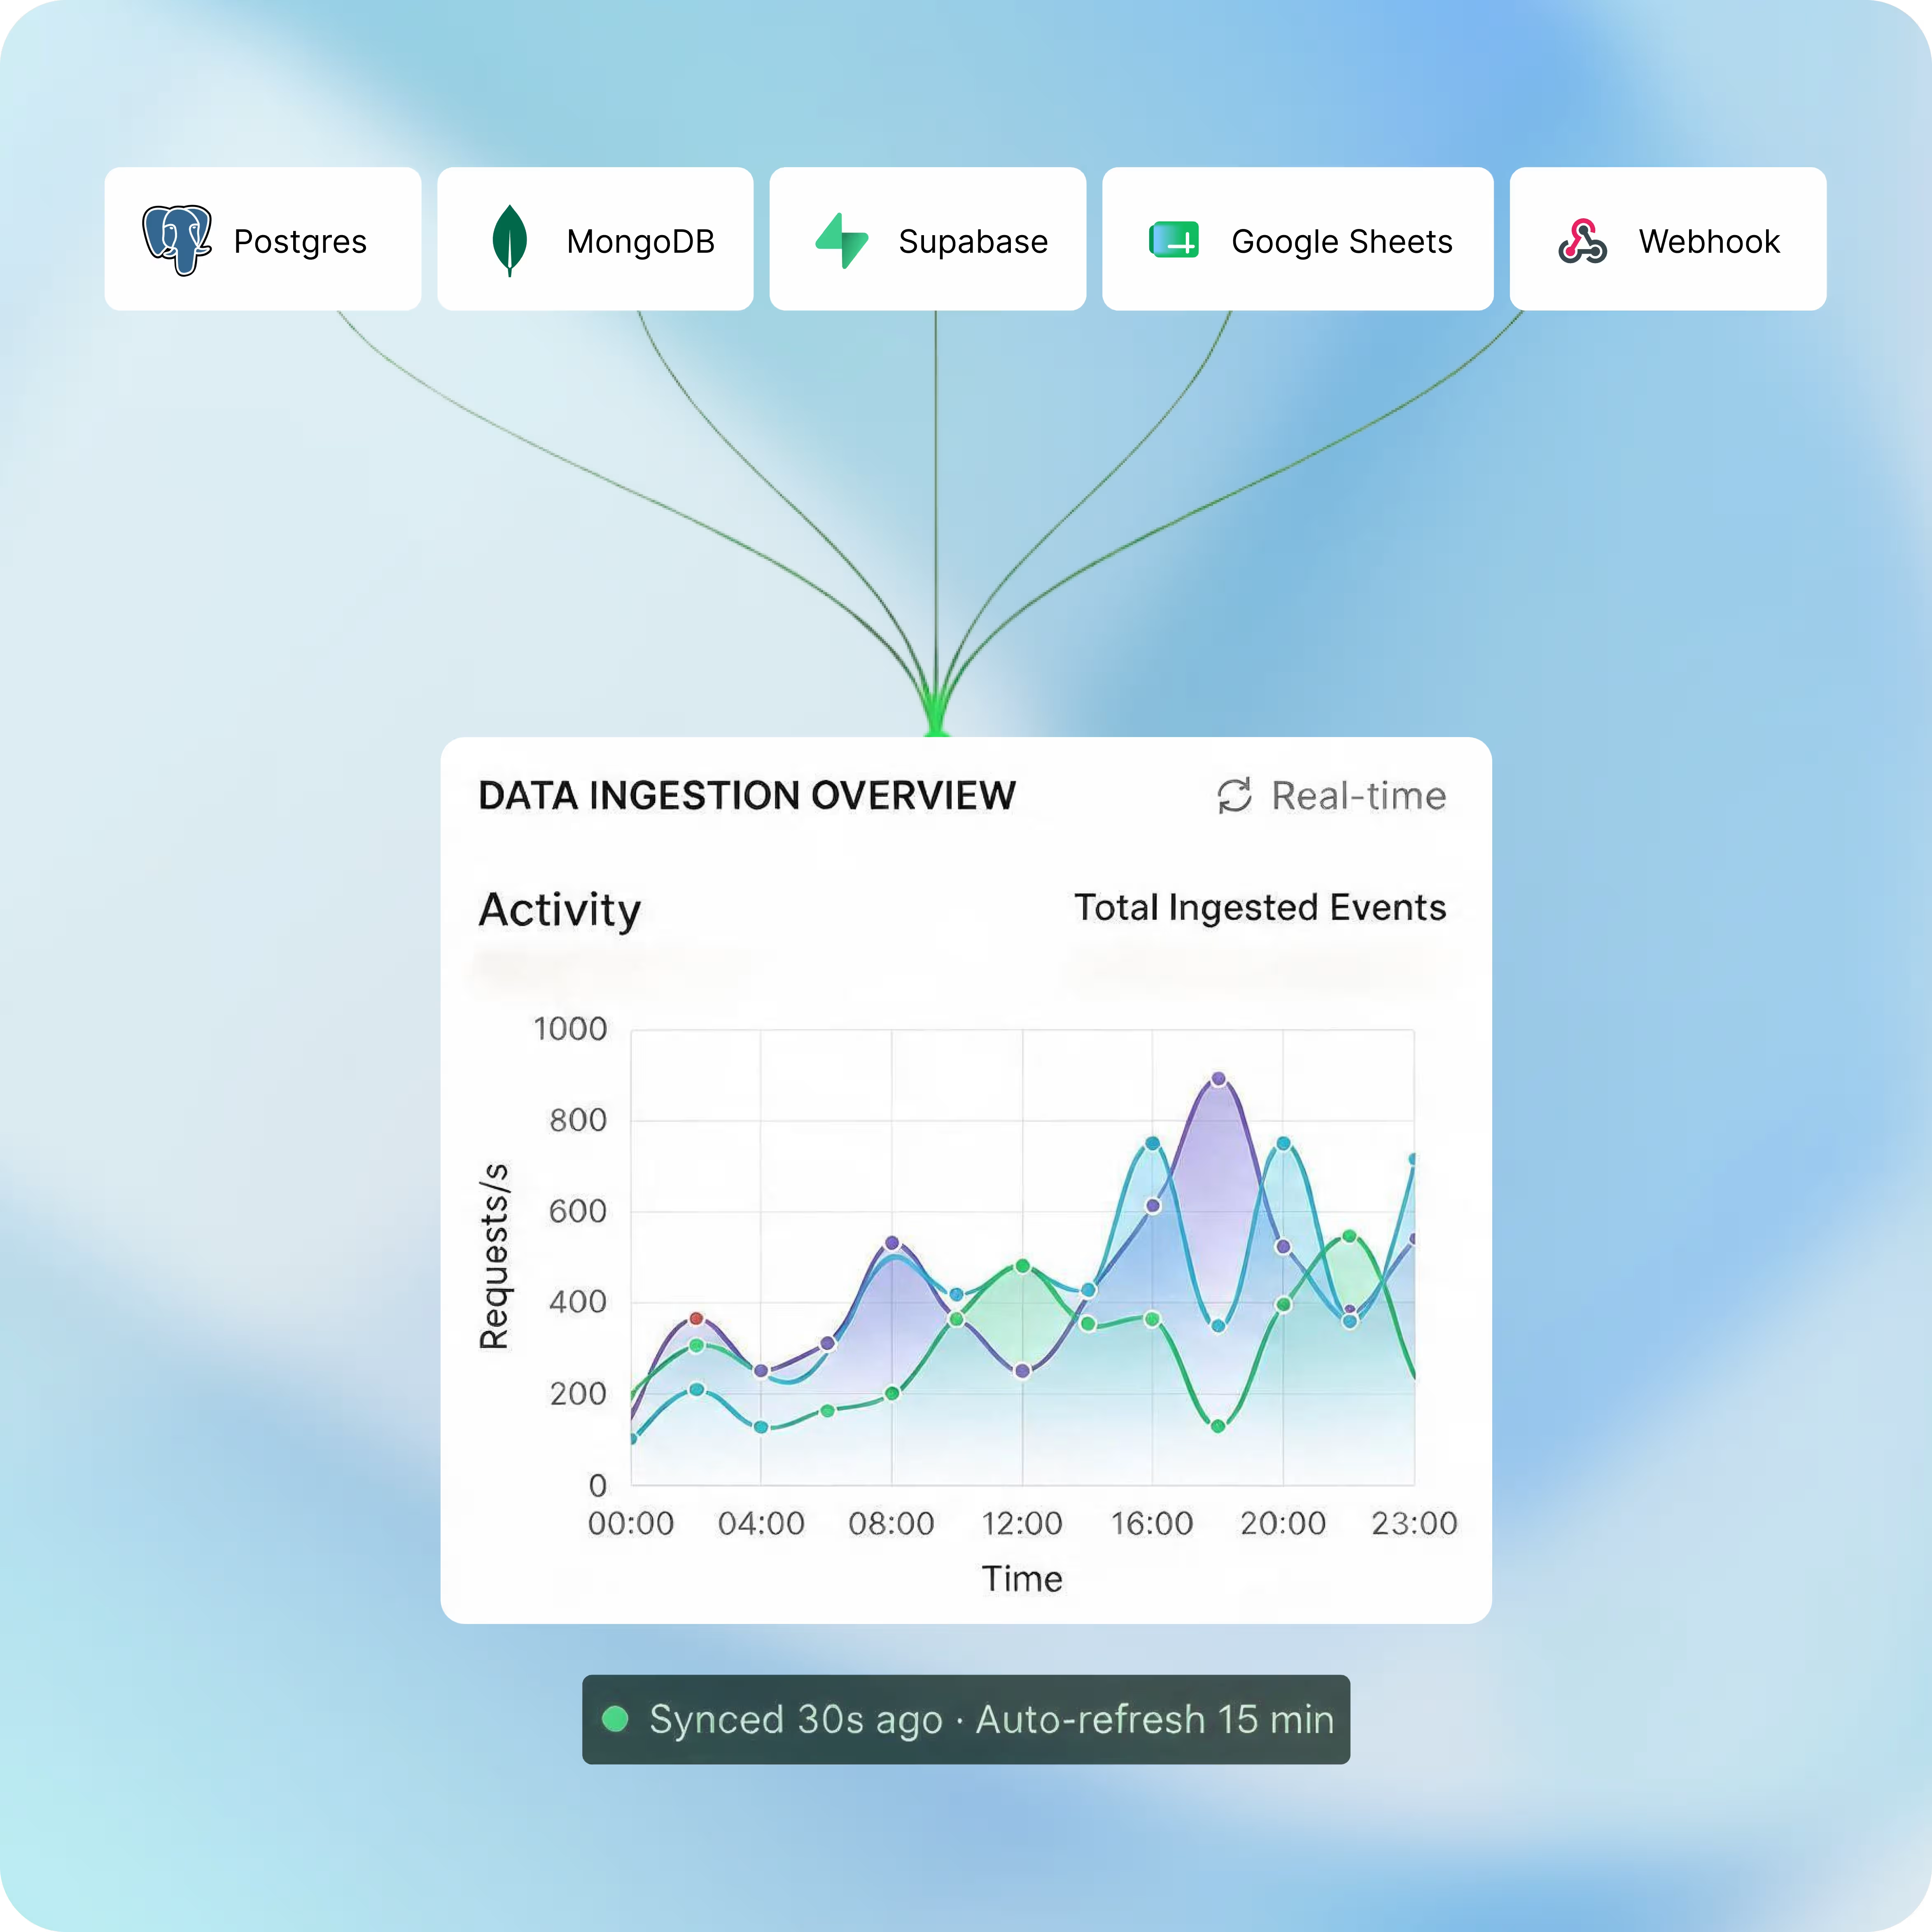
Connect your data. See it update on its own.
Your dashboard should pull live numbers, not wait on manual updates. Point Emergent at your data and it keeps every chart current, no exports or copy-paste needed.
- Connect databases, spreadsheets, and datasets
- Pull in live data through APIs and webhooks
- Refresh metrics automatically on a schedule
- Combine sources into one unified view
Turn your idea into a website. Launch instantly.
Describe your website in plain language and Emergent builds it from the ground up. No templates, no setup, no waiting.
- Describe, don’t code:Write what you need in plain language and instantly generate the layout, components, and logic.
- Full UI in one go:Create full pages with forms, tables, filters, and charts in a single automated pass.
- Use the data you already have:Connect your spreadsheets or datasets quickly and turn them into interactive dashboards.
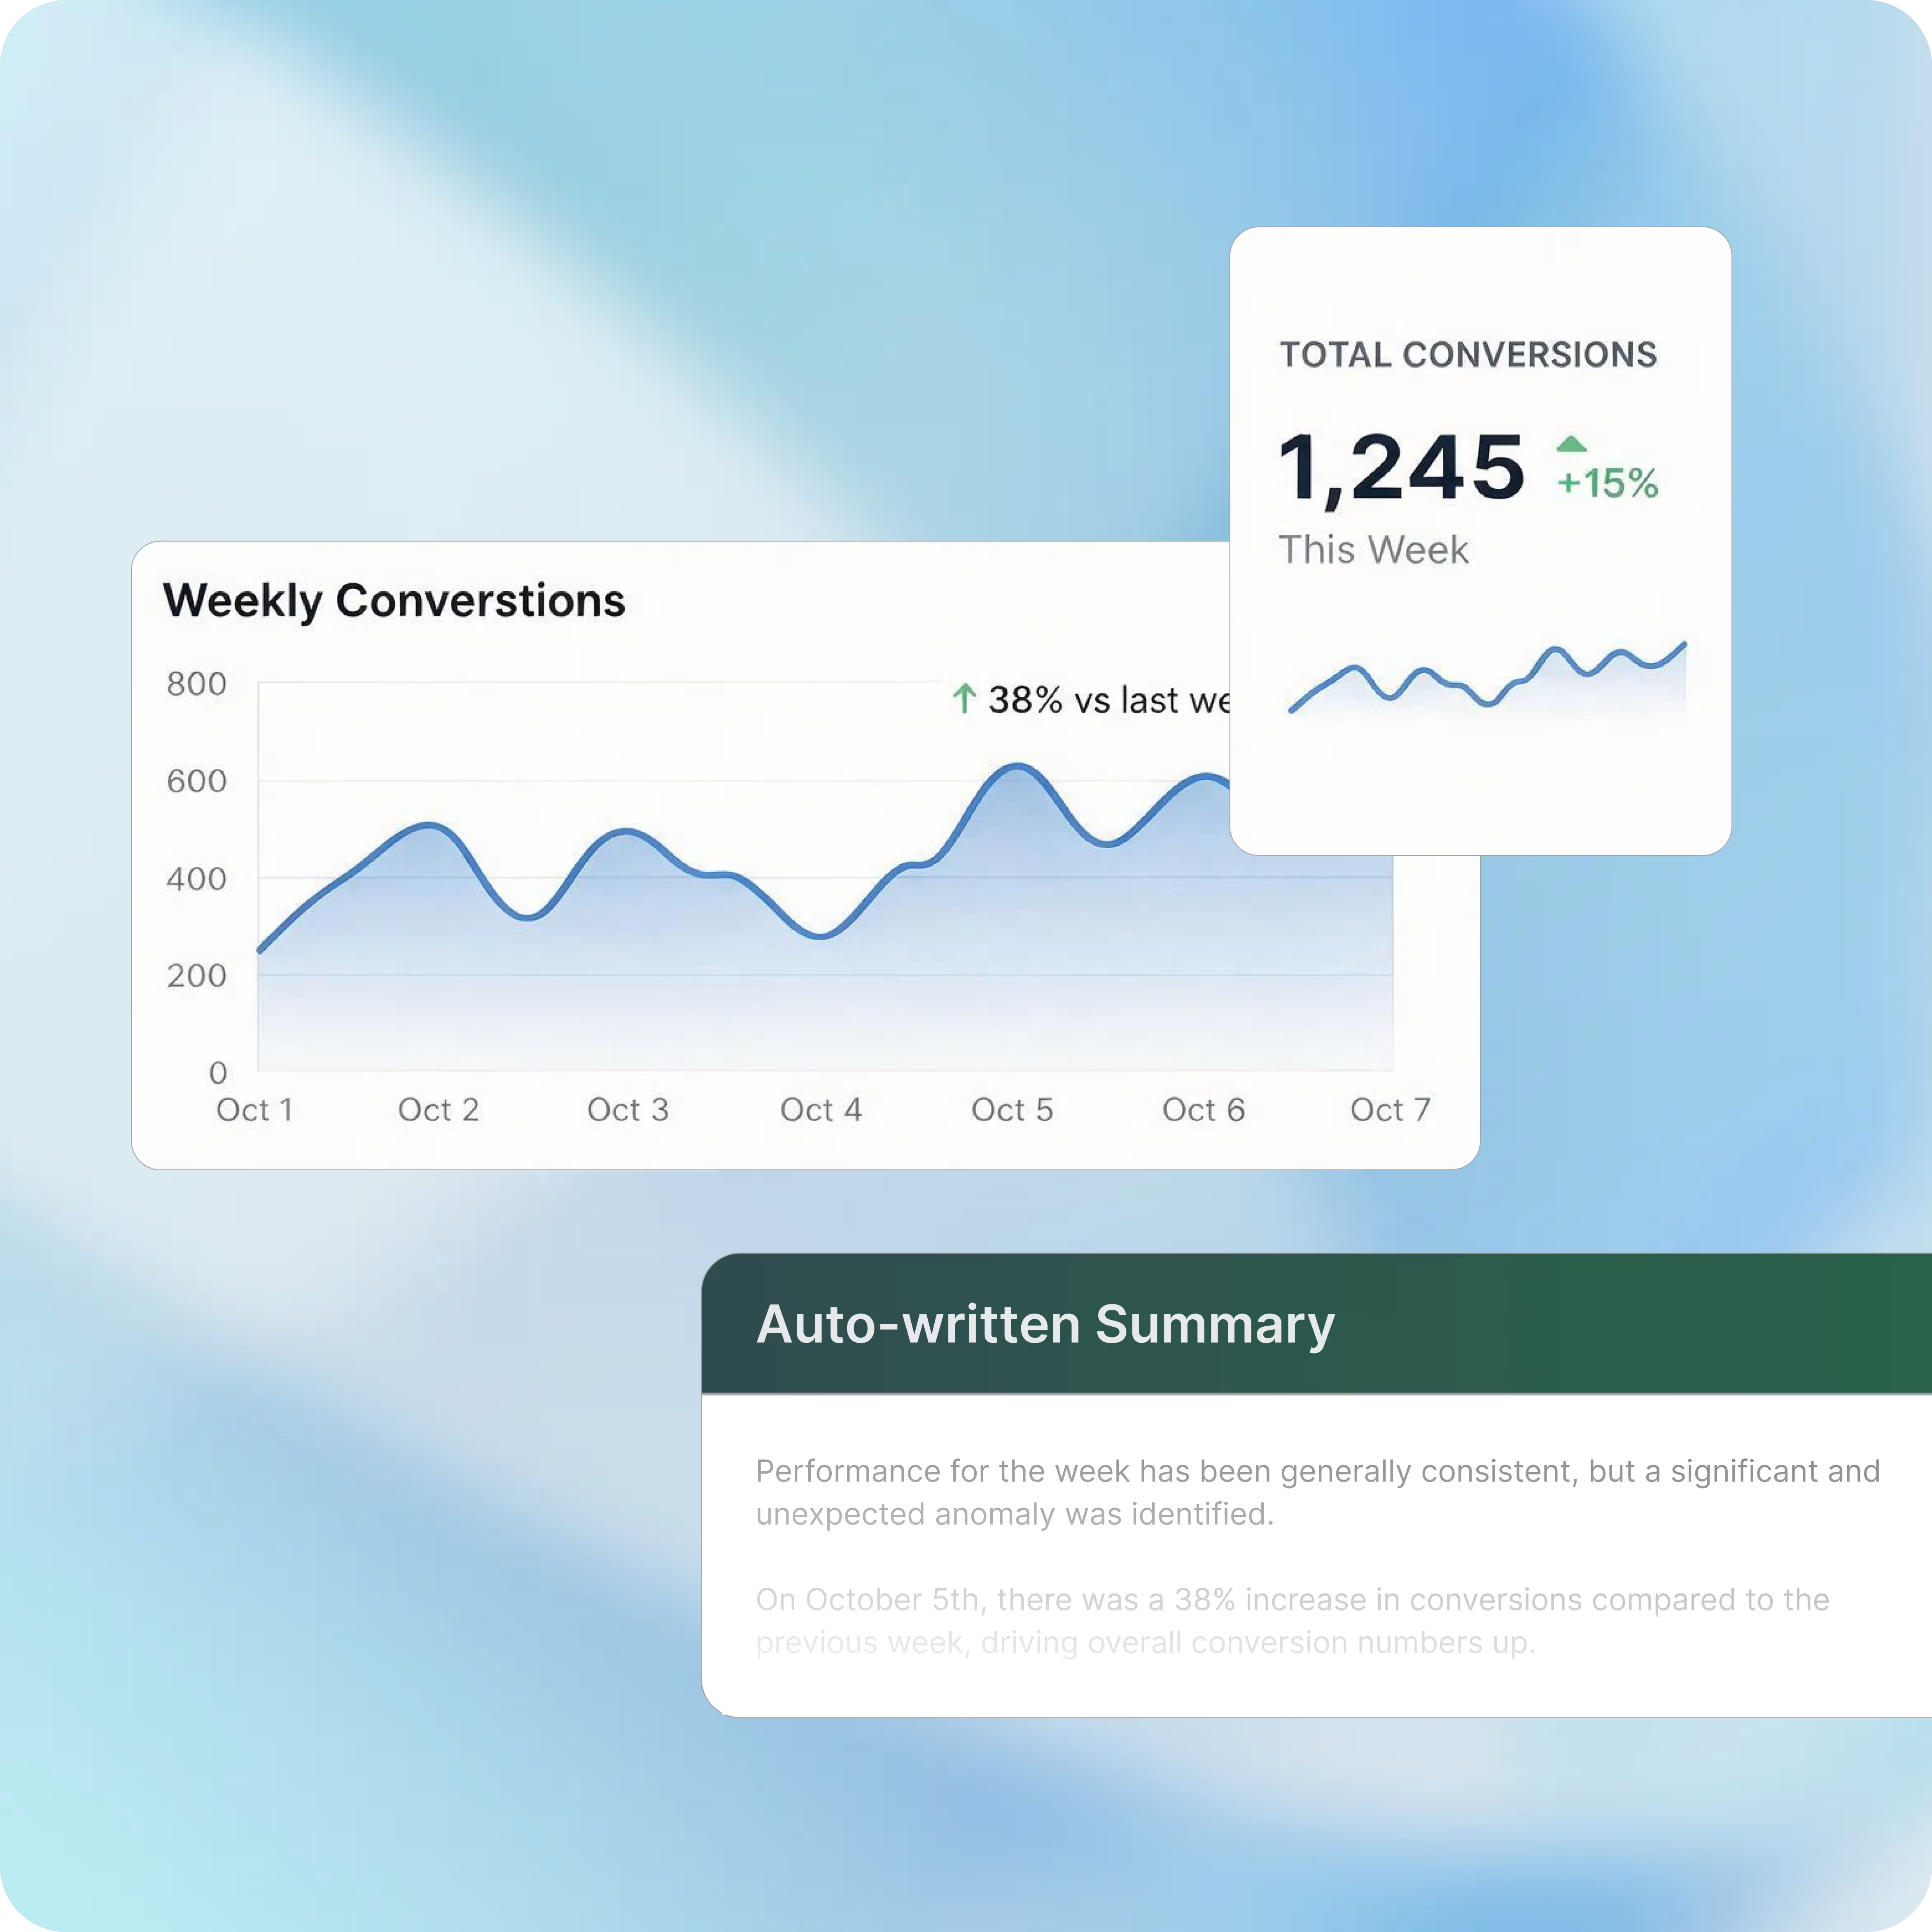
Turn raw data into answers. Automatically.
Your dashboard should do the analysis, not your team. Describe the metric you want and Emergent builds the calculation, no formulas or developers needed.
- Define KPIs, ratios, and rollups in plain language
- Group, filter, and segment data on the fly
- Flag anomalies and trends as they happen
- Generate summaries and scheduled reports
Turn your idea into a website. Launch instantly.
Describe your website in plain language and Emergent builds it from the ground up. No templates, no setup, no waiting.
- Describe, don’t code:Write what you need in plain language and instantly generate the layout, components, and logic.
- Full UI in one go:Create full pages with forms, tables, filters, and charts in a single automated pass.
- Use the data you already have:Connect your spreadsheets or datasets quickly and turn them into interactive dashboards.
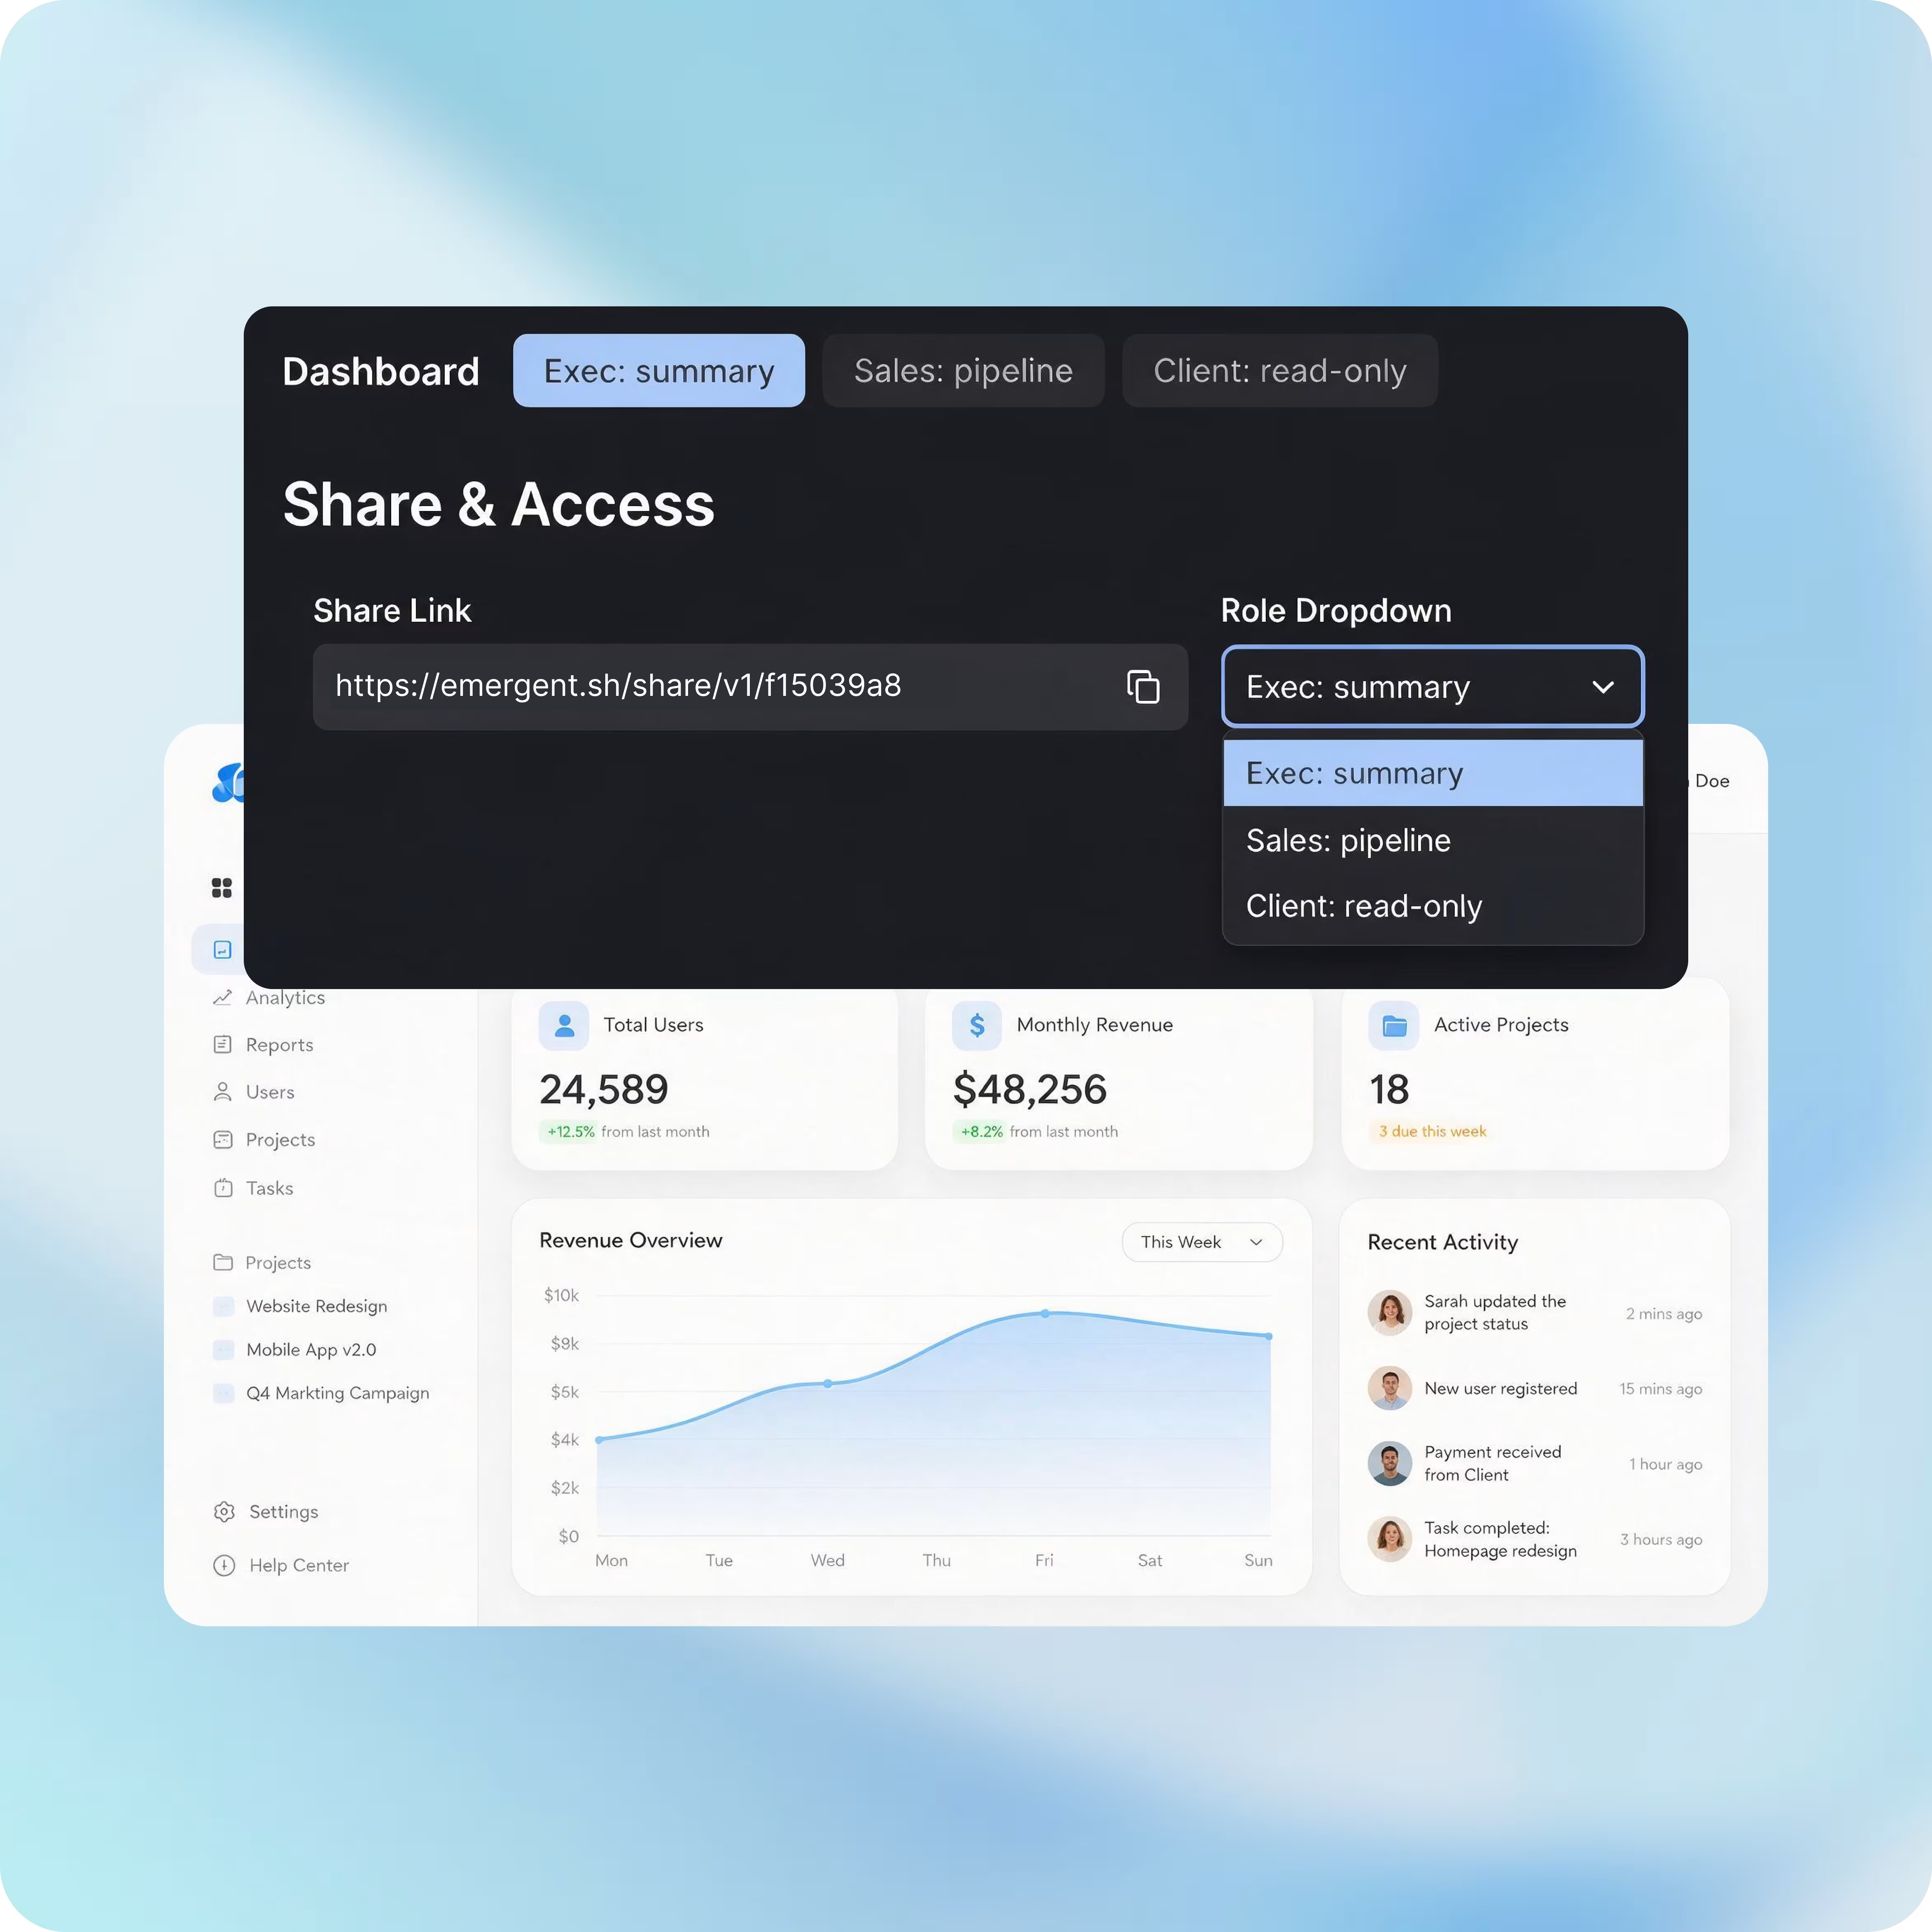
Share the numbers with the right people
Right now "sharing" a dashboard means a screenshot in Slack or handing everyone the same view whether it's meant for them or not. Emergent lets you send one live link and control exactly what each person sees.
- Share a live link instead of stale screenshots
- Give execs the summary and teams their own slice
- Role-based access so sensitive numbers stay hidden
- Secure login and encryption built in by default
How Emergent Help You Build a Dashboard for Your Needs?
Four steps from raw data to a working dashboard. No setup, no spreadsheets to wrangle, no guesswork.






Integrations That Fit
Your Dashboard Stack
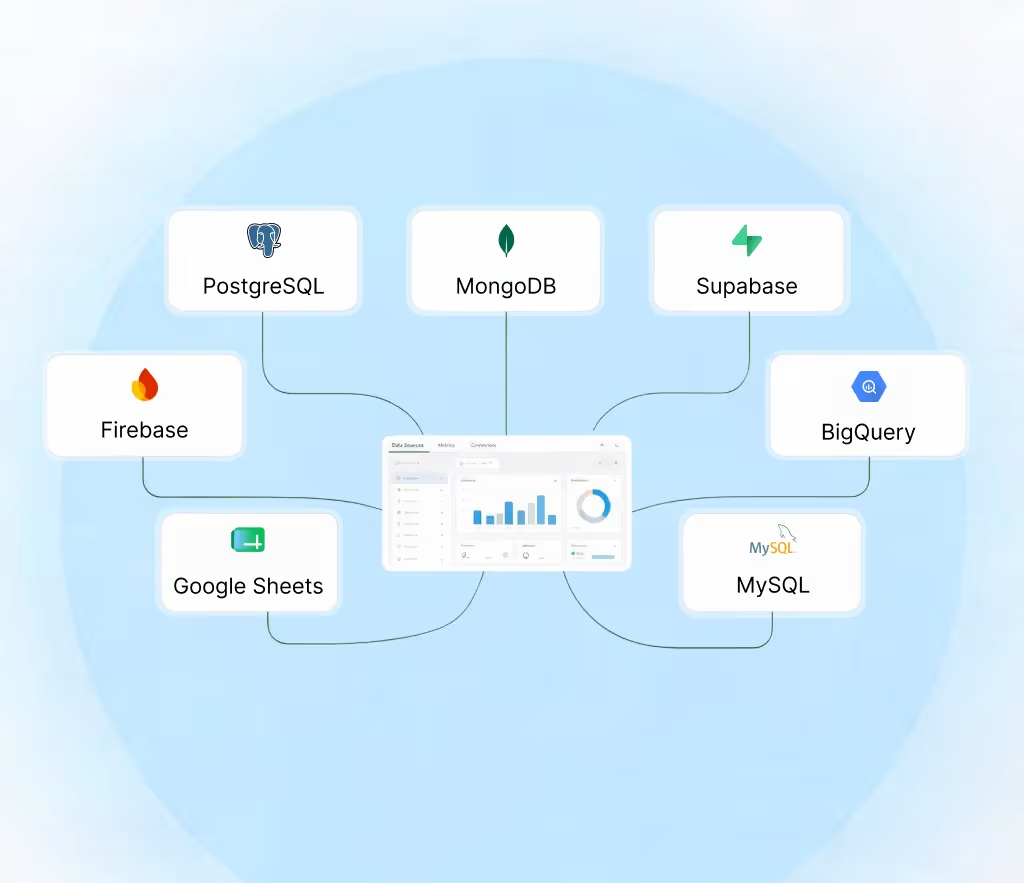
Databases and Data Sources
- Connect databases and data warehouses
- Import from spreadsheets and datasets
- Sync sources so every chart stays current
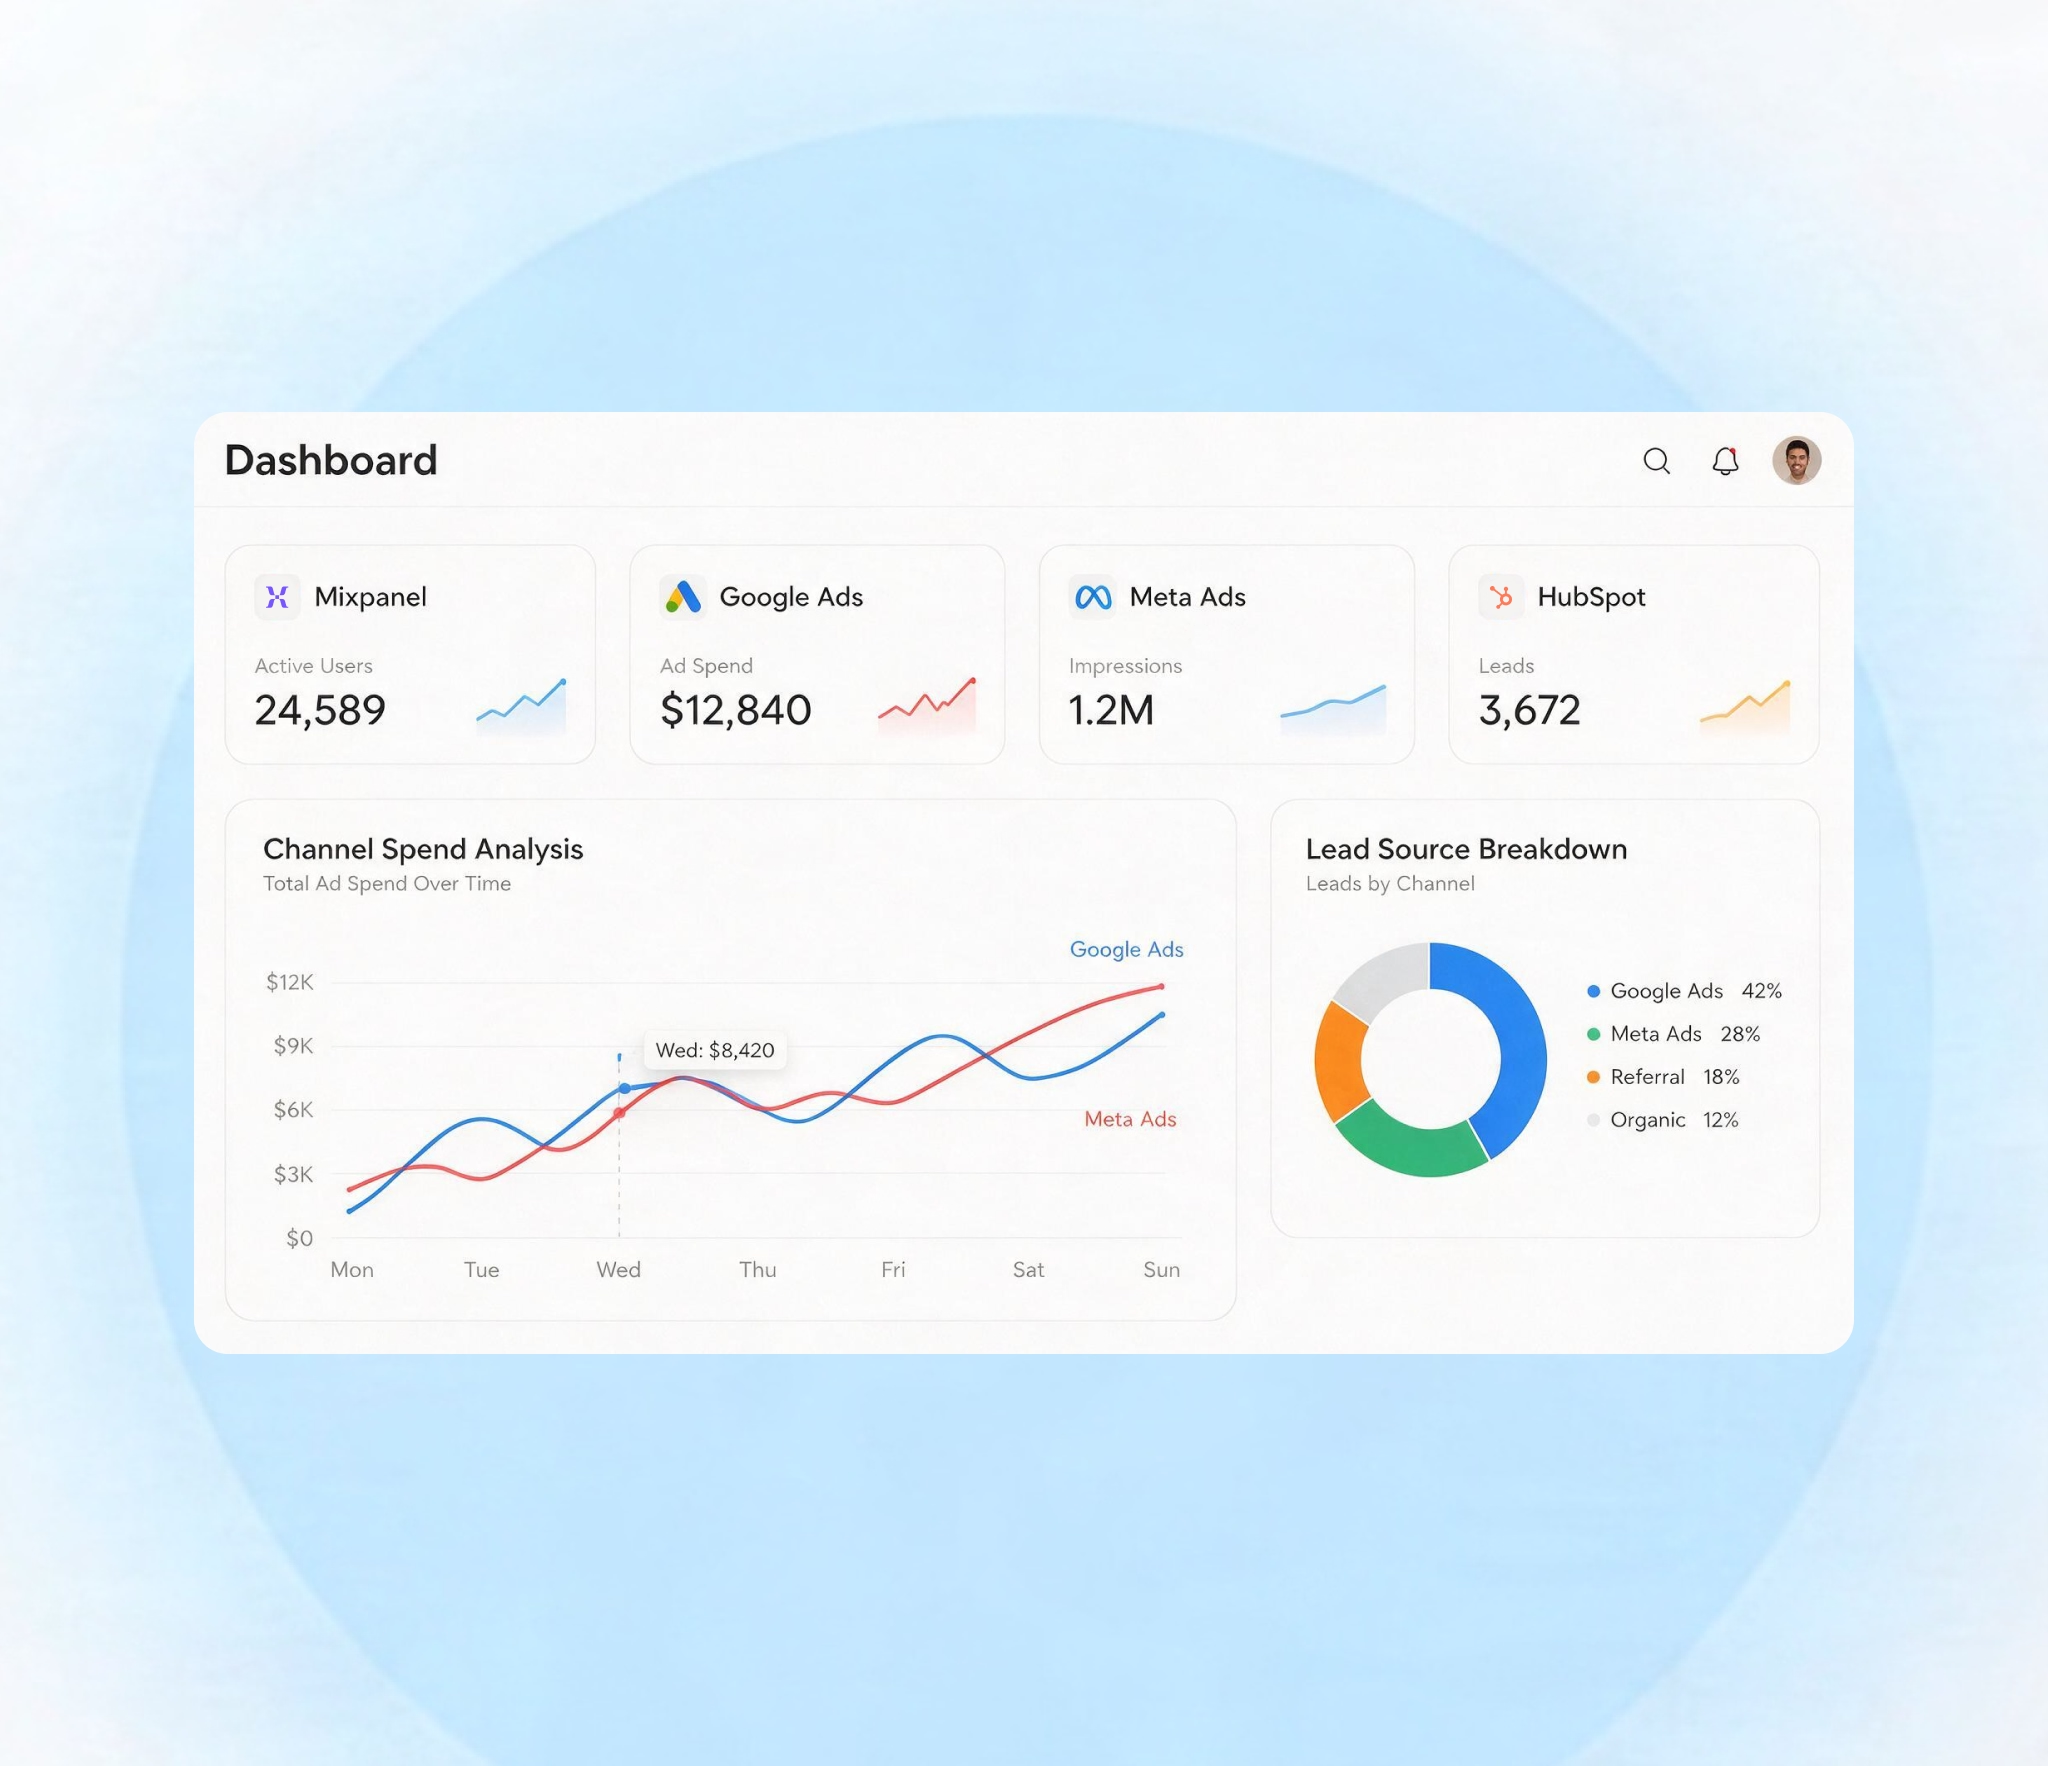
Analytics and Product Tools
- Pull in web and product analytics
- Track campaign and revenue data side by side
- See all your KPIs without switching tabs
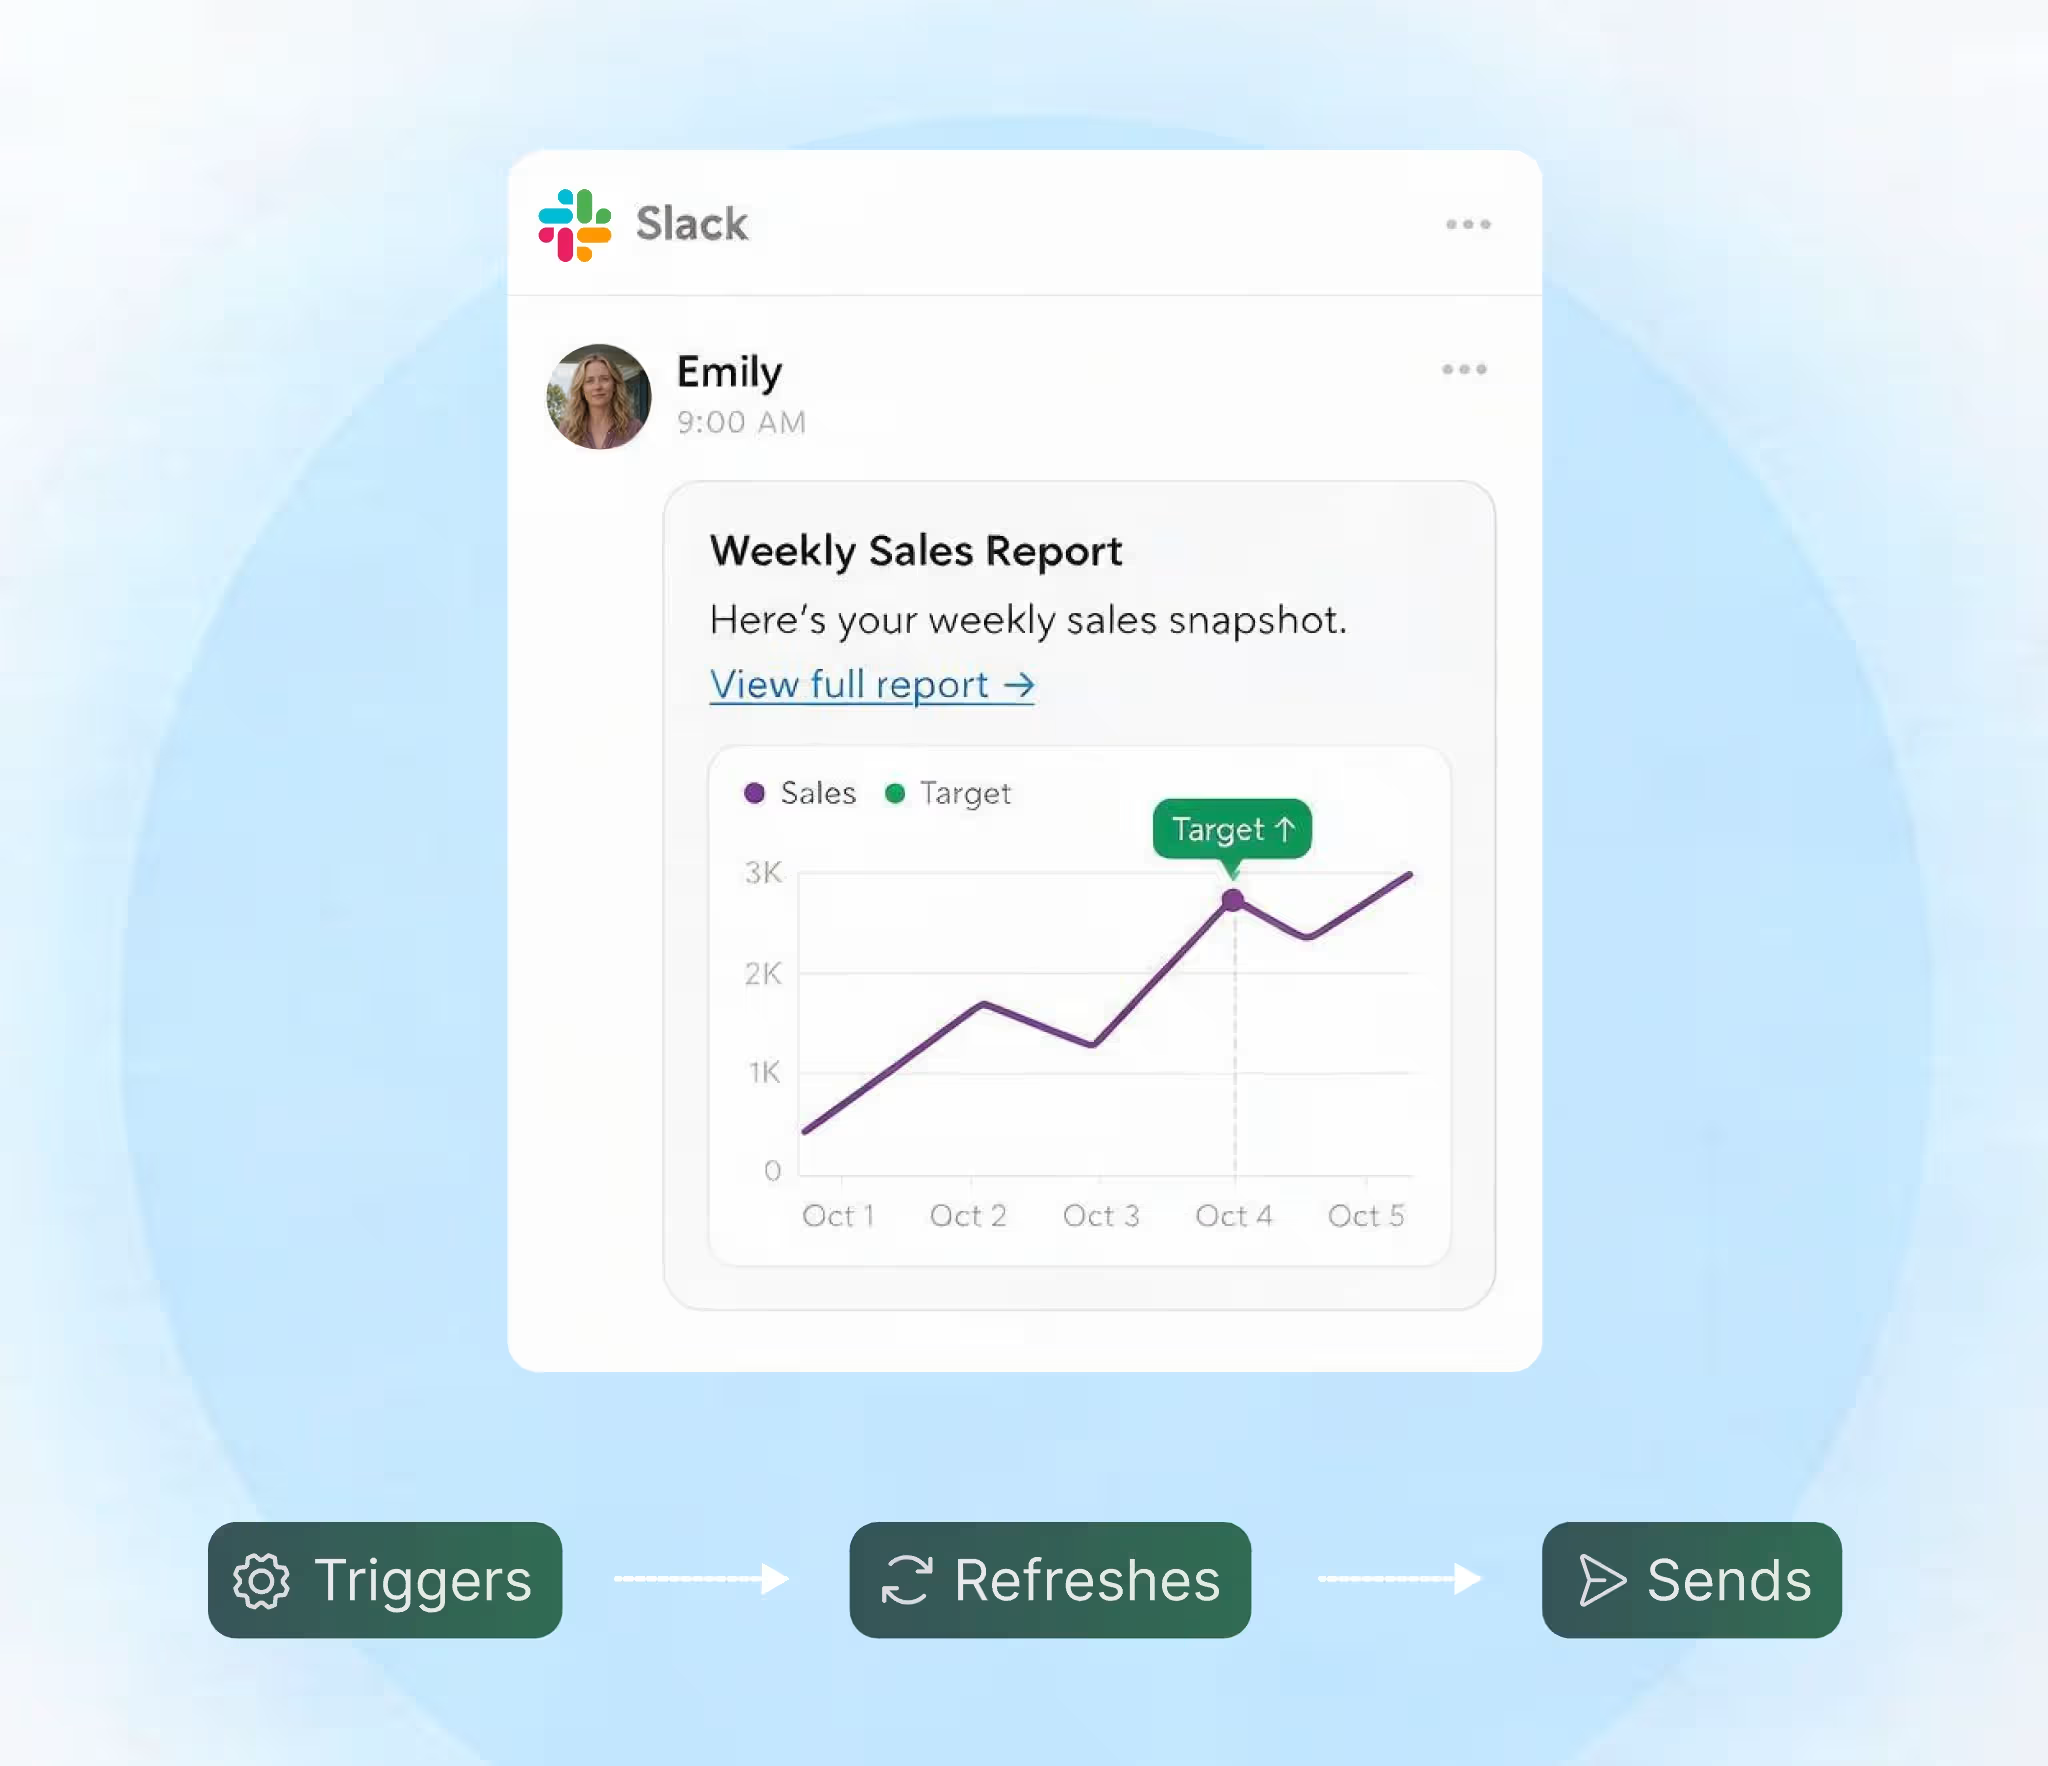
Automation & Reporting
- Connect thousands of apps in a few clicks
- Trigger actions and refreshes automatically
- Turn dashboard data into scheduled reports
Connect the Tools Your Dashboard Needs
Beyond databases, analytics, and alerts, connect payment tools, authentication systems, and the internal software your team runs on. With full API access, you can wire up almost any tool you use, so your dashboard fits your stack instead of the other way around.

Pick the Pricing Plan That Works for You
Choose the plan that fits your building ambitions. From weekend projects to enterprise applications, we've got you covered.
No credit card required*


Find the Right Dashboard Builder
for Your Business
Frequently Asked Questions
Your Questions, Answered
An AI dashboard builder lets you create a working dashboard by describing it in plain language. Instead of setting up charts and queries by hand, you say what you want to track and the AI builds the layout, connects your data, and generates the visualizations for you.
No. You do not need SQL, spreadsheet formulas, or any coding. If you can describe the metrics you want to see, Emergent handles the queries, logic, and design behind them.
Template tools give you a fixed layout you have to fit your data into, and most BI platforms need an analyst to set up and maintain. Emergent builds the dashboard around your data and your questions, and you change it yourself just by asking, with no specialist in the loop.
You can connect databases like PostgreSQL, MongoDB, and Supabase, import spreadsheets and datasets, and pull from analytics, CRM, and other tools. With API access, you can connect almost any source your data lives in.
Yes. You can blend data from multiple databases, spreadsheets, and tools into one view, so you do not have to jump between systems to see the full picture.
Yes. Your dashboard pulls from your live data and stays in sync as the numbers change, so you are not rebuilding it or pasting in fresh exports every week.
Yes. You can set role-based access so each person sees only the views meant for them, and share a live link with teams or clients instead of a static file.
Yes. Emergent is ISO 27001 and SOC 2 certified, with authentication, role-based access controls, and encryption built in by default. Your data and your users' data stay protected without any security expertise on your end.
Yes. You can adjust charts, layouts, colors, and branding anytime by describing the change. Your dashboard adapts as your business and your questions evolve, with no rebuild needed.
Yes. You keep control of your dashboard and its data, and you can extend or grow it as your needs change. It runs on production-ready hosting, so it stays fast as more people use it.
on Emergent today




