

borHey there!
In this tutorial, we're going to build something pretty powerful: a Data Analysis Dashboard that lets you analyze Google Sheets and Excel files with AI, without paying $16.80 per user per month for Google Workspace's Gemini integration.
The idea is simple: instead of being locked into expensive enterprise plans just to get AI-powered data analysis, this app does it for you.
Basically, we'll build an intelligent dashboard that:
- Accepts Excel files (.xlsx, .xls) or Google Sheets links
- Automatically detects column types and generates business insights
- Creates interactive charts and visualizations
- Lets you chat with your data using natural language
- Delivers strategic analysis without the enterprise price tag
Using this, you can upload any dataset and instantly see trends, patterns, and actionable insights, plus you can even ask inferential questions and get intelligent answers.
By the end of this guide, you'll have your own AI-powered data analysis tool, built entirely on Emergent, that helps you make data-driven decisions without any manual number crunching or expensive subscriptions.
Let's get started!
Why This Matters
So here's the thing: Google Workspace includes Gemini AI for data analysis, but it's locked behind their expensive Business plan at $16.80 USD per user per month.
If you have a team of 10 people who need data analysis capabilities, that's over $2,000 per year just for AI features.
This setup works perfectly as an alternative because:
- It's cost-effective. Build once, use forever.
It's flexible. Want to analyze data from Excel? Google Sheets? CSVs? It handles all of them without jumping between platforms. - It's intelligent. The AI will provide strategic business insights, detect trends, identify outliers, and answer complex questions.
- It's customizable. You can also tune the analysis style, add features, and modify the interface to match your exact workflow.
So instead of paying enterprise prices for basic AI analysis, we're building a custom solution that's smarter, cheaper, and tailored to how you actually work.
Understanding the Architecture
Let's break down what we're actually building in simple terms:
At its core, this is a full-stack web application that combines data processing, AI analysis, and interactive visualization.
Think of it like this:
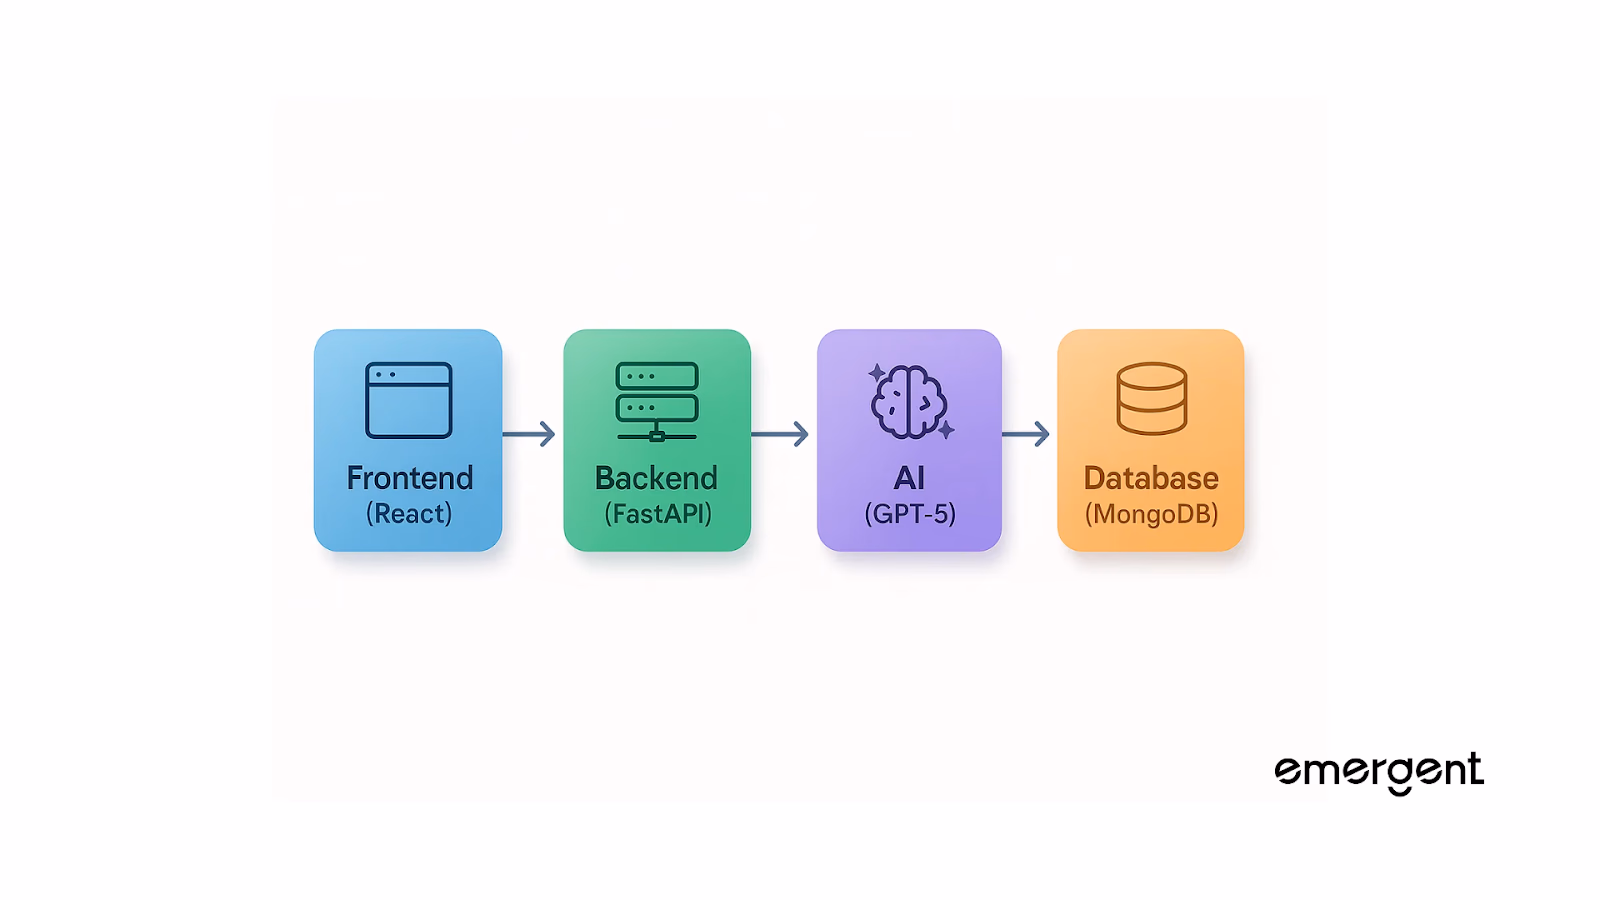
Frontend (React) = your interface, where you upload files, see charts, and chat with your data.
Backend (FastAPI + Pandas) = the engine, it parses spreadsheets, runs statistical analysis, and processes your questions.
AI Layer (GPT-5) = the intelligence, it generates insights, answers questions, and provides strategic recommendations.
Database (MongoDB) = the memory, it stores your datasets and conversation history.
With this setup, here's what happens:
- You upload an Excel file or paste a Google Sheets link
- The backend parses the data and detects column types (numeric, categorical, dates)
- GPT-5 analyzes the entire dataset and generates business insights
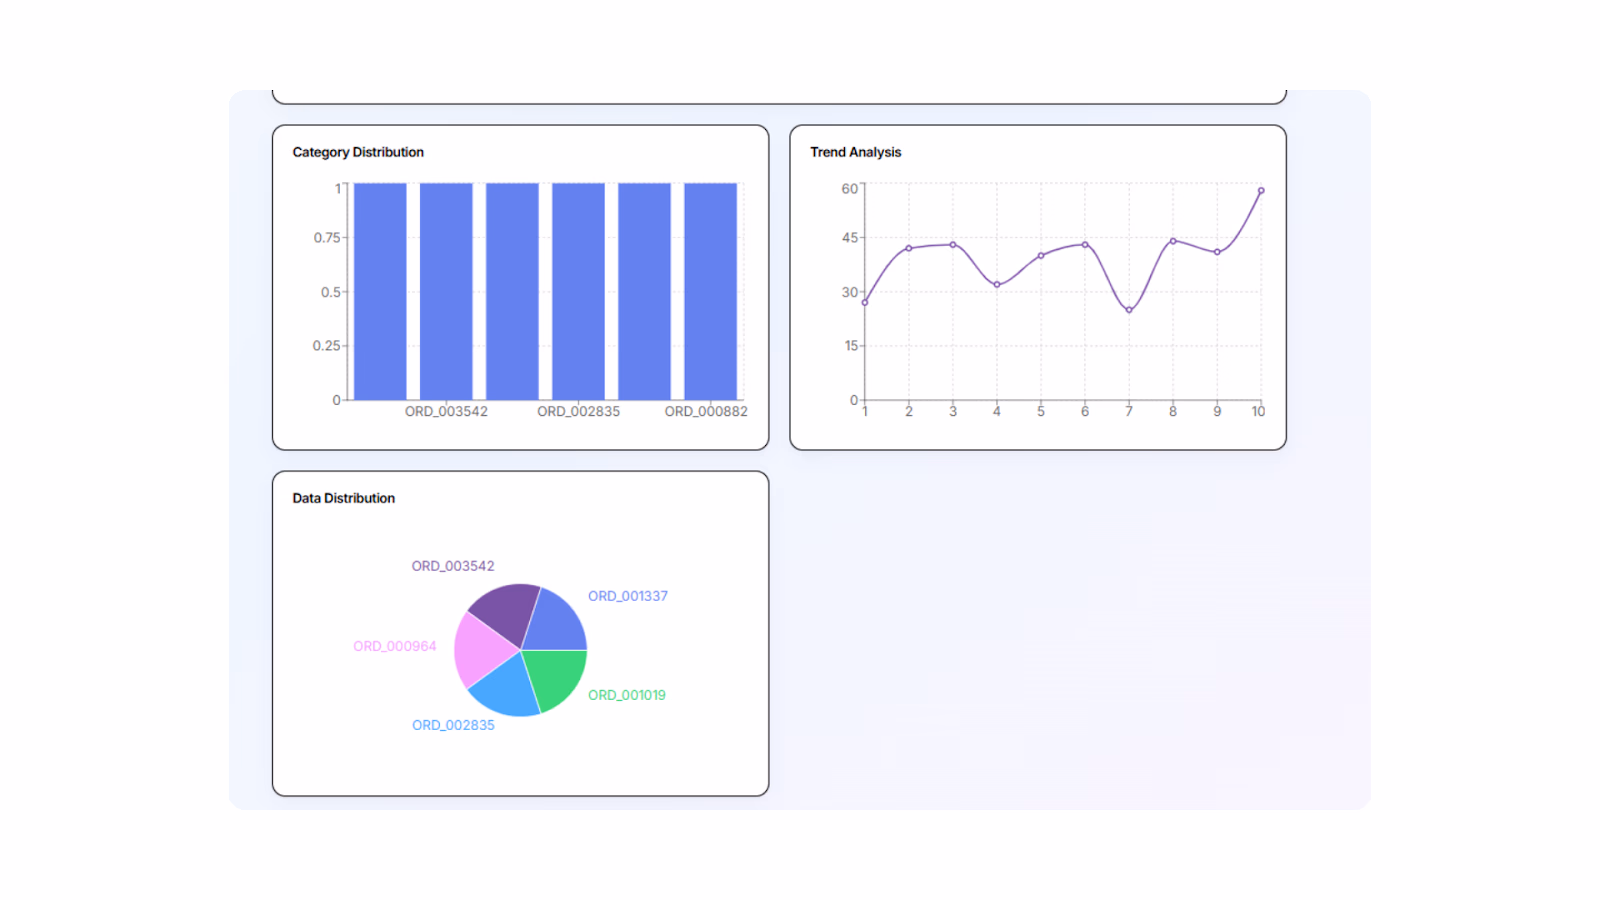
- Interactive charts automatically display based on your data
- You can ask questions in plain English and get intelligent answers
- The AI can even generate new charts based on your queries
In short, you get enterprise-grade data analysis without enterprise pricing, and it's all running on infrastructure you control.
Building the Data Analysis Dashboard on Emergent
Now that you understand what we're building, it's time to actually create the app.
Don't worry, Emergent's agent will do the heavy lifting!
Step 1: Defining What You Want
First, you need to tell Emergent exactly what your app should do.
We use a clear, detailed prompt that gives the agent enough context without overloading it.
Here is the exact prompt we used:
"Build a full-stack web app where users can upload an Excel file or paste a Google Sheets link to automatically analyze and visualize their data.
When a user uploads a file or link:
Parse the data and detect numeric, categorical, and date columns.
Generate an AI-powered summary highlighting key insights, trends, and anomalies.
Display an interactive dashboard with charts (bar, line, pie) showing the most relevant metrics.
Add a chat interface where users can ask questions about their data — for example:
“What’s the top-performing category?”
“Show sales trends over time.”
“Predict next month’s total revenue.”
The app should include:
A clean, modern UI with a white background, soft shadows, and clear data visuals.
Tabs or sections for “Upload,” “Dashboard,” and “Chat with Data.”
Support for both .xlsx uploads and Google Sheets links.
Real-time updates after new uploads.
Keep the experience simple and fast — the goal is to turn any raw spreadsheet into a beautiful, interactive data companion."
Step 2: Answering the Agent's Questions
After entering the prompt, the agent will ask a few questions to finalize the setup:
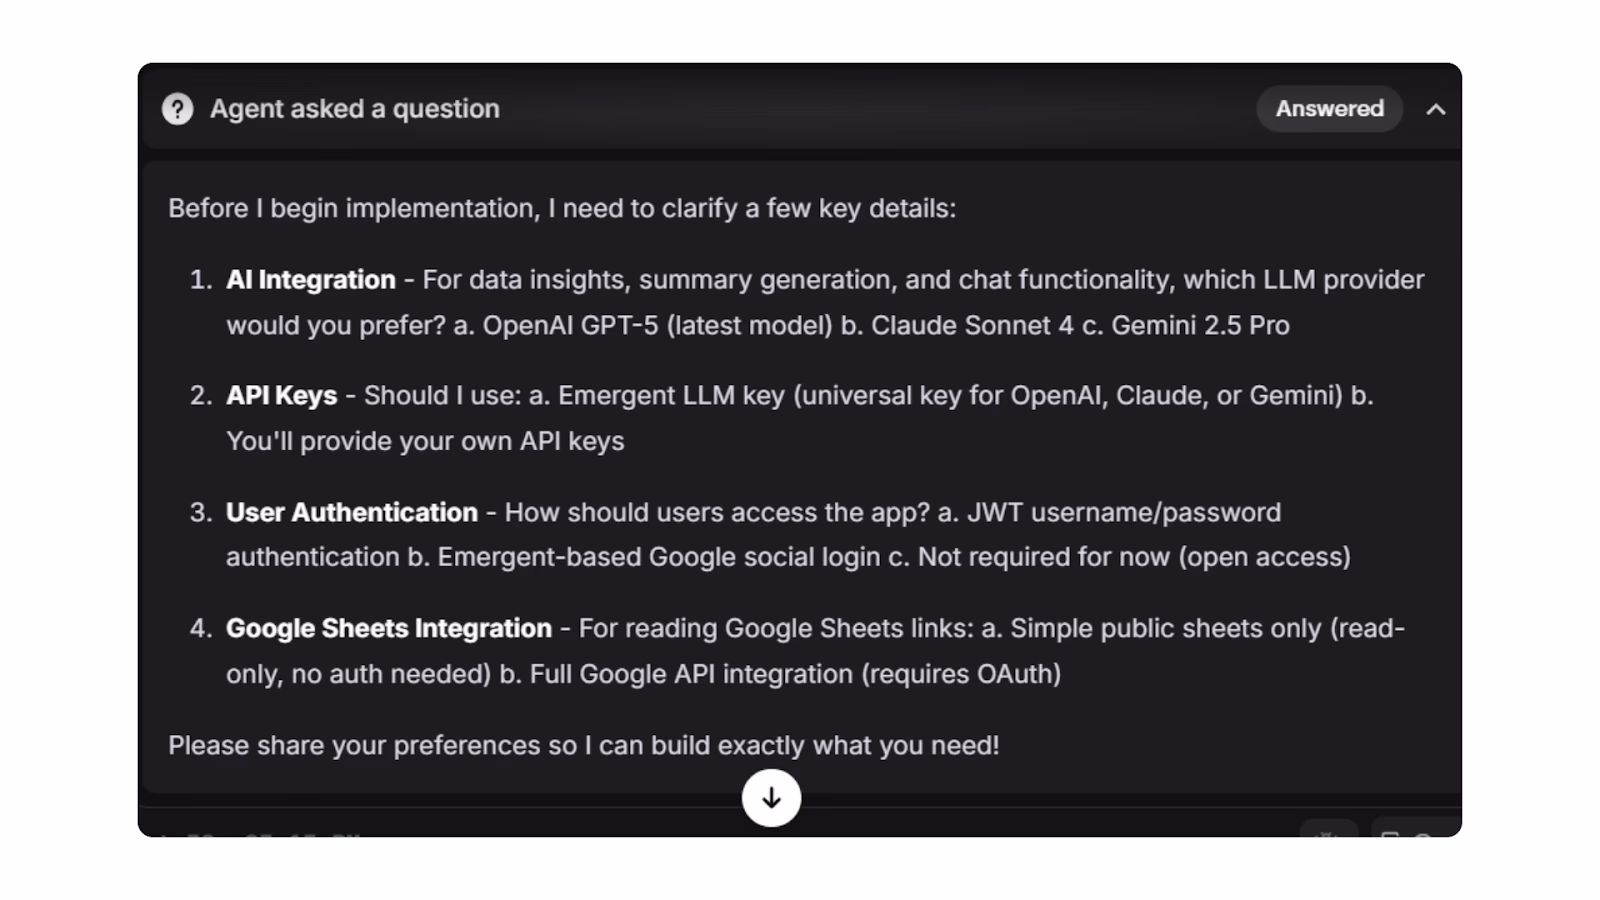
Which LLM should I use? I chose GPT-5 because it's the best for processing natural language and doing complex data analysis. You can also use Claude Sonnet or Gemini 2.5 Pro depending on your preference.
API Key? Here's the cool part: Emergent provides a Universal LLM Key, so you don't need separate OpenAI, Anthropic, or Google API keys. You just use your Emergent credits to access any LLM directly through the platform.
User authentication? You have a few options here:
- JWT(JSON Web Token) username/password authentication
- Google social login
- Not required (for testing)
For this tutorial, we're going with "Not required for now" since we're building a functional prototype first. You can always add authentication later.
Google Sheets integration? You can choose between:
- Simple public sheet access (read-only, easiest to set up)
- Full Google API integration with OAuth (more advanced, allows editing)
We're starting with simple public sheet access for now.
Once you answer these questions, the agent starts building your app.
Step 3: Watching the Agent Build
After you provide the requirements, Emergent's agent gets to work. Here's what happens behind the scenes:
The agent creates a full-stack architecture with React frontend, FastAPI backend, and MongoDB database. It sets up the file upload system, integrates Pandas for data processing, and connects GPT-5 for AI analysis.
But here's the really cool part: there's a testing agent that runs automatically while the app is being built. This testing agent checks if everything works properly, and if it finds problems, the main agent debugs itself.
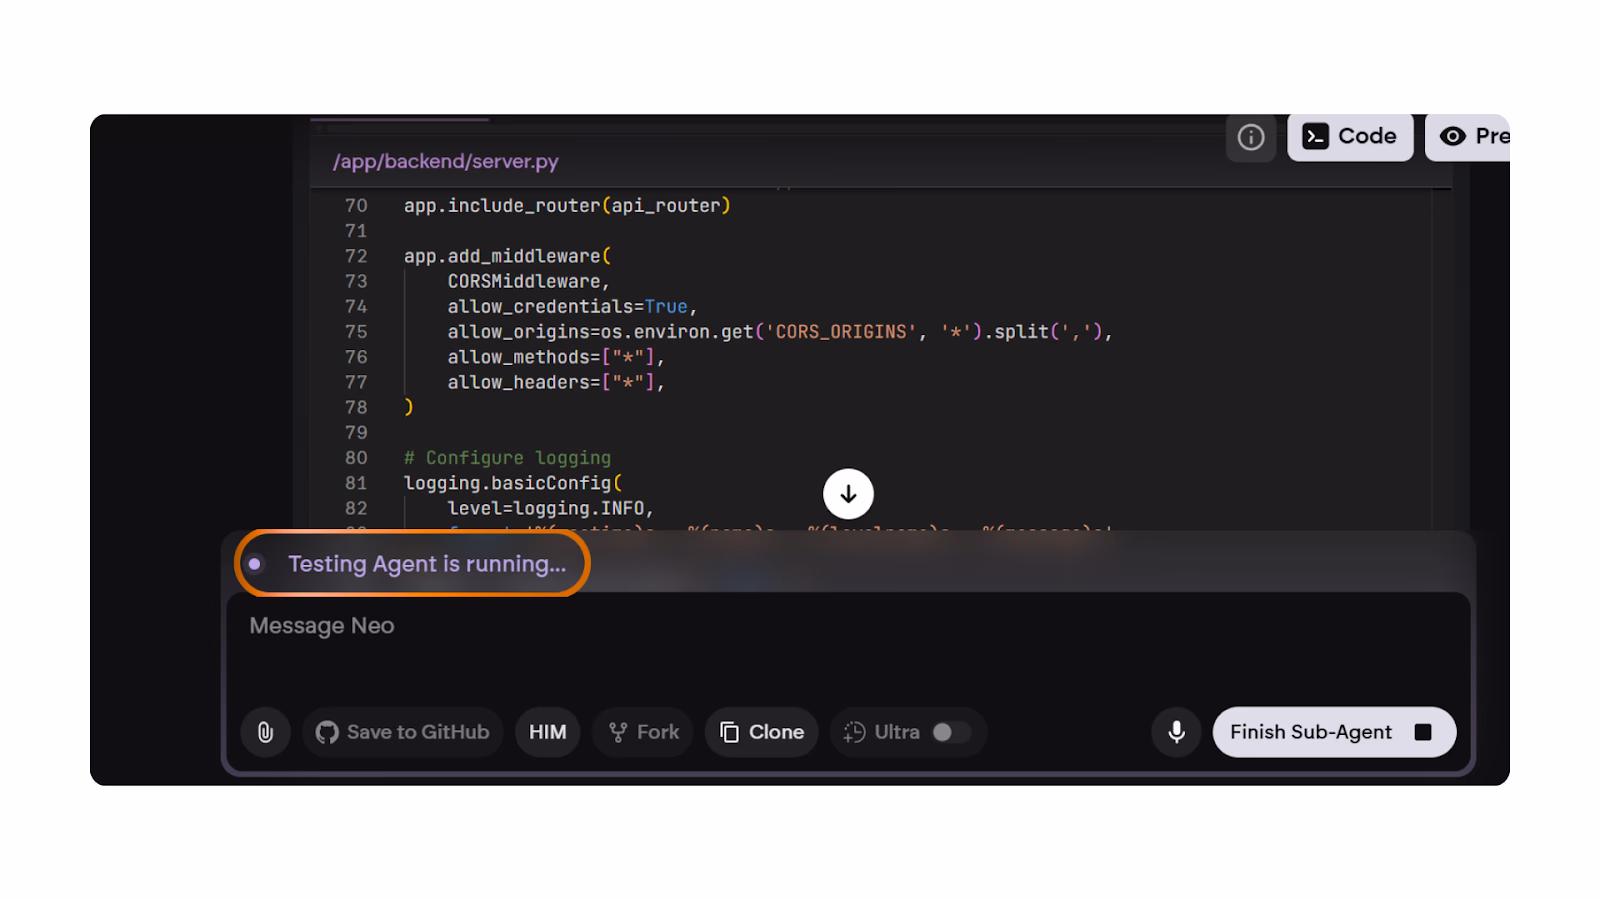
This is why we're called an agentic platform. Our agents can think, debug themselves, and iterate to improve.
If you see the testing agent running for too long, you can pause it and ask it to perform manual checks. Once it confirms that all checkpoints are met (data uploads work, charts display, chat responds), it gives you an option to preview the app you just created.
Click that link and you'll see your first working version.
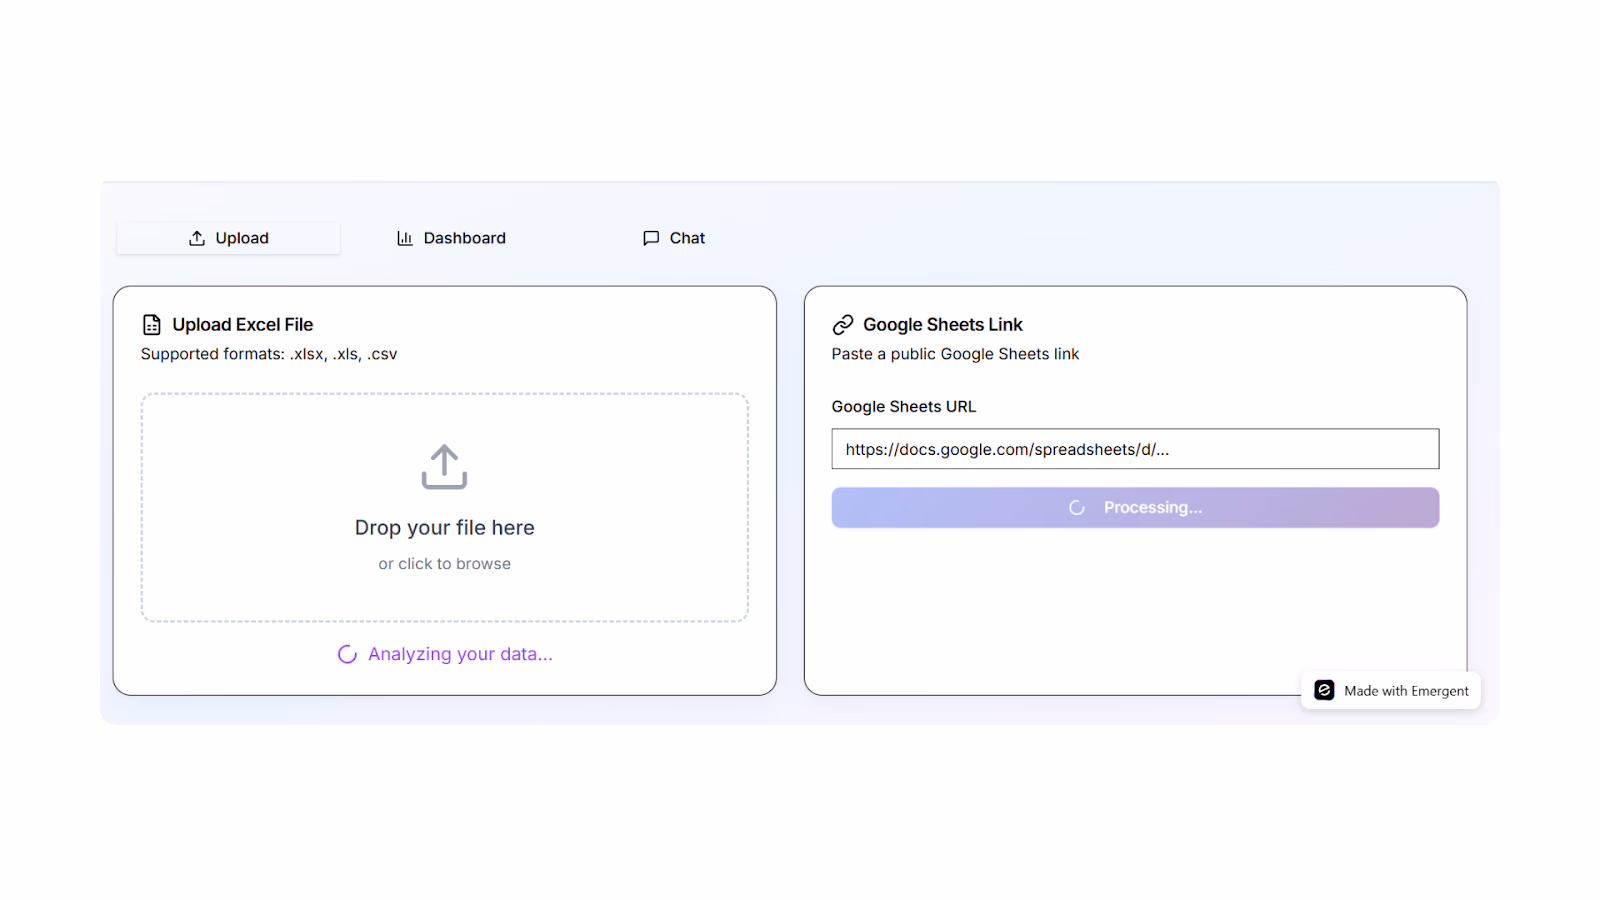
For me, it was this (using test data here) :
Testing, Debugging, and Improving Your Dashboard
Once your Data Analysis Dashboard is live, the next step is making sure it actually delivers useful insights. Even the best AI agents can produce first drafts that need refinement.
I started by uploading a test dataset (Dataset) and checking if the charts, insights, and chat responses made sense.
Most of the time it worked smoothly, but I noticed a few issues that needed fixing.
Issue 1: The UI Wasn't Intuitive
What I saw: The Google Sheets and Excel upload options were in the same tab, which felt cluttered and confusing. Also, the Dashboard and Chat sections were showing up before I even uploaded any data, which didn't make sense from a user experience perspective.
What I did: I took screenshots of the UI issues and shared them with the Emergent agent, explaining what felt wrong
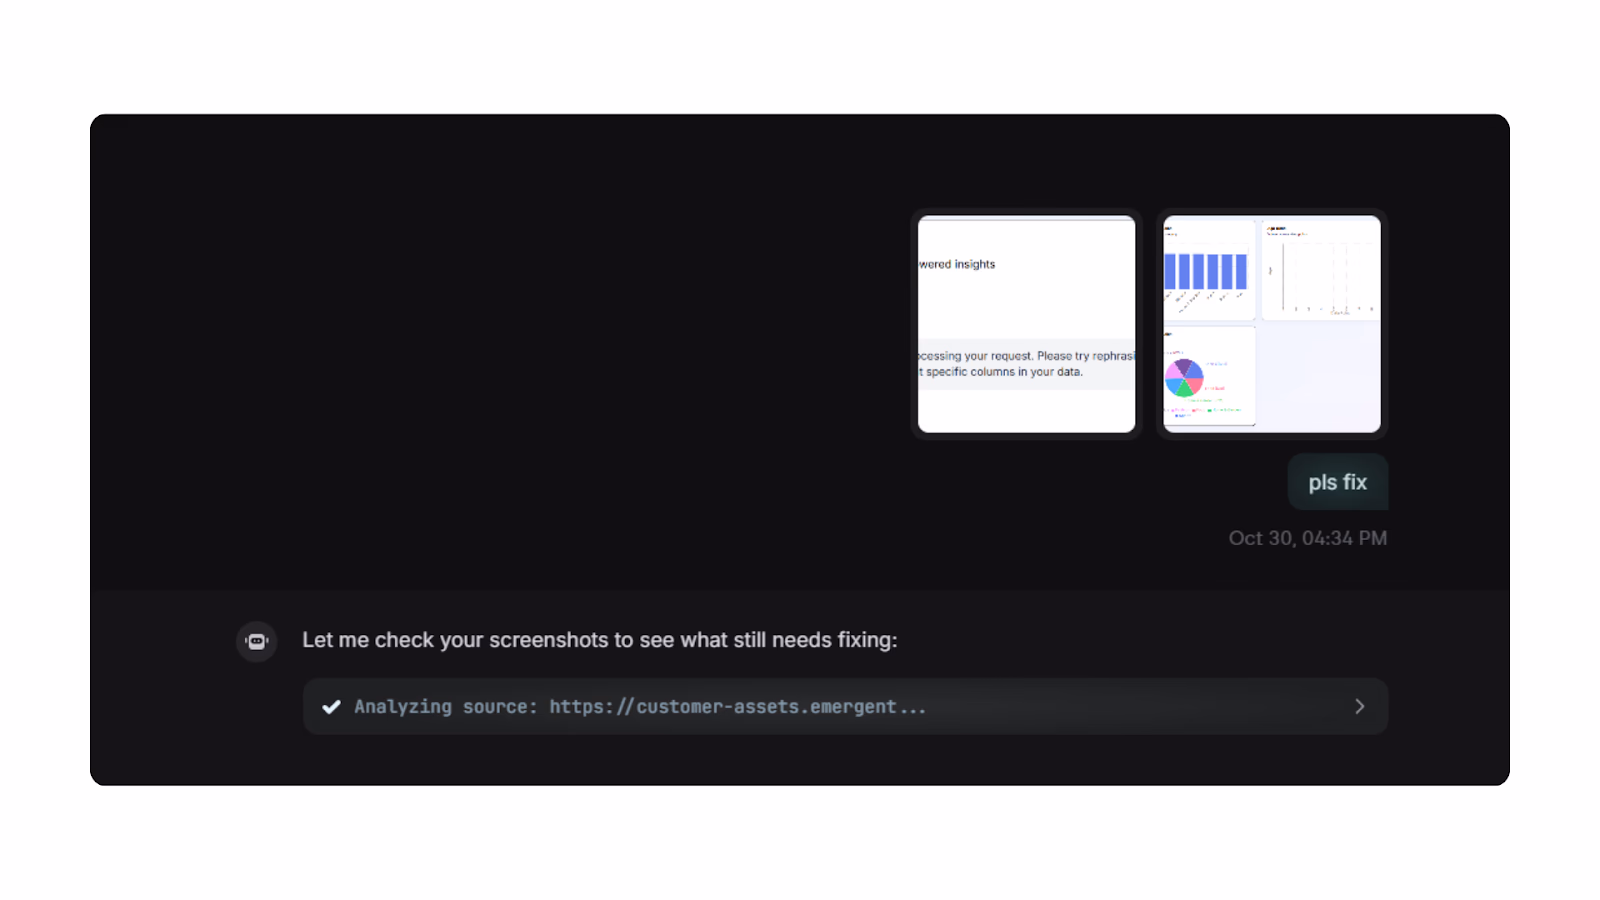
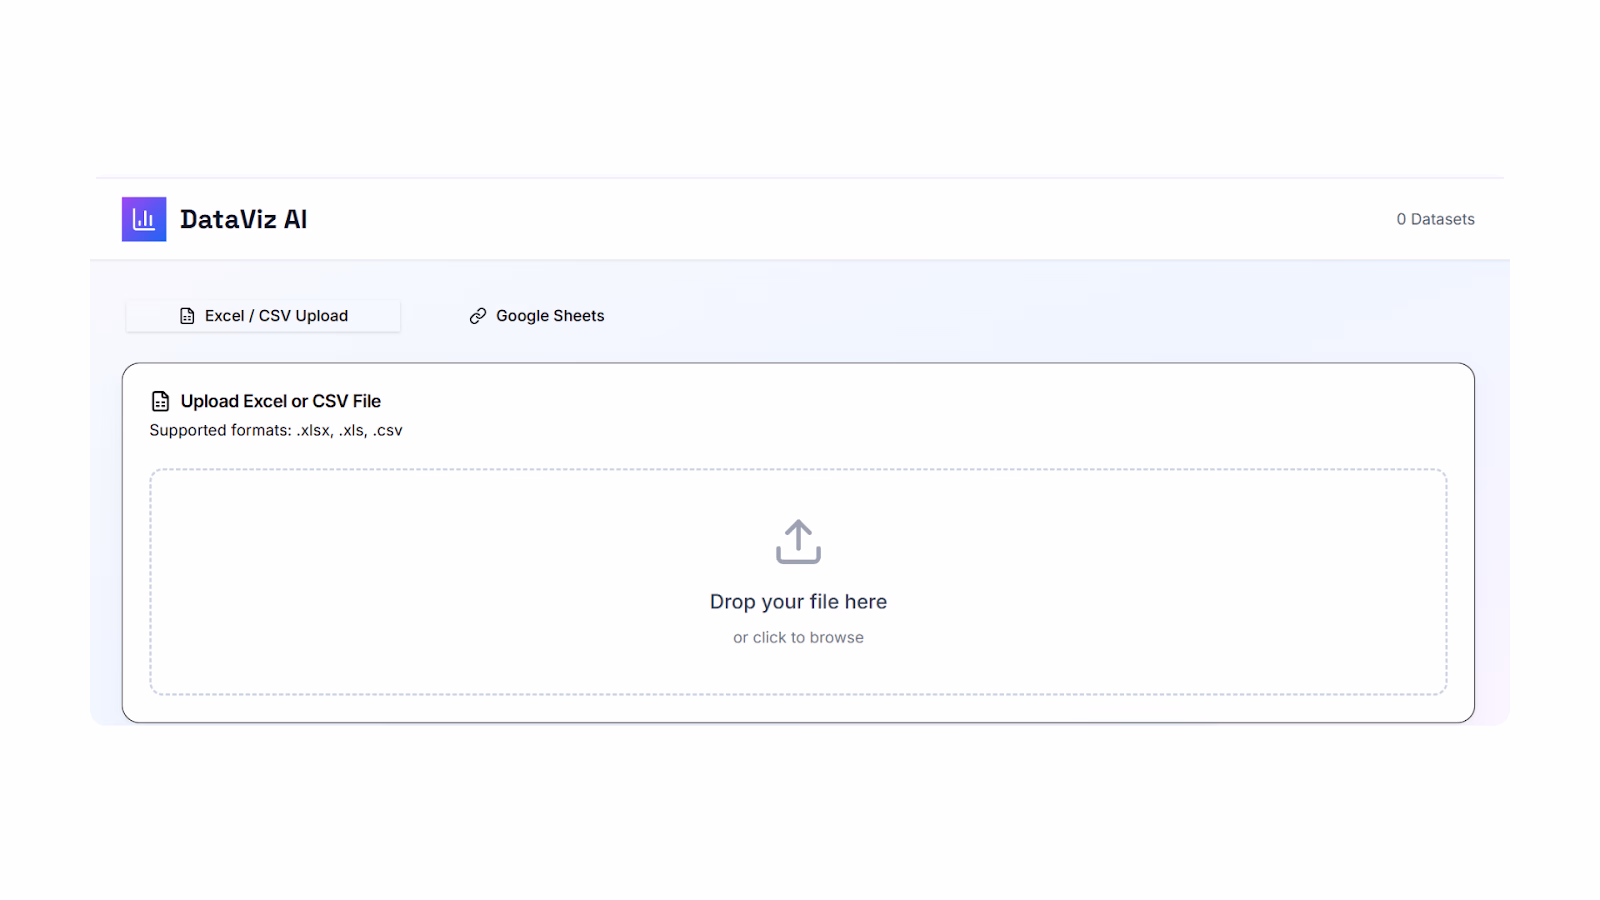
How the agent fixed it: The agent automatically updated /app/frontend/src/App.js to create separate tabs for Excel and Google Sheets, and made the Dashboard and Chat sections only appear after data upload. It even implemented a split-screen view with Dashboard on the left and Chat on the right.
Issue 2: Analysis Was Too Generic
What I saw: The AI was giving me very surface-level insights like "Your dataset has 150 rows and 5 columns" or "Here are the column names." I don't care about that, I wanted actual business insights.
What I did: I told the agent: "The analysis is too generic. I want strategic insights, trend analysis, and actionable recommendations."
How the agent fixed it: This is where the agent made some major improvements. It went into /app/backend/server.py and upgraded the entire analytical framework and changed the prompt it was giving to GPT.
You can also change the system prompt given to GPT according to your preference. I asked the agent to change the prompt being fed.
For example, I asked the agent to change the prompt, like this :
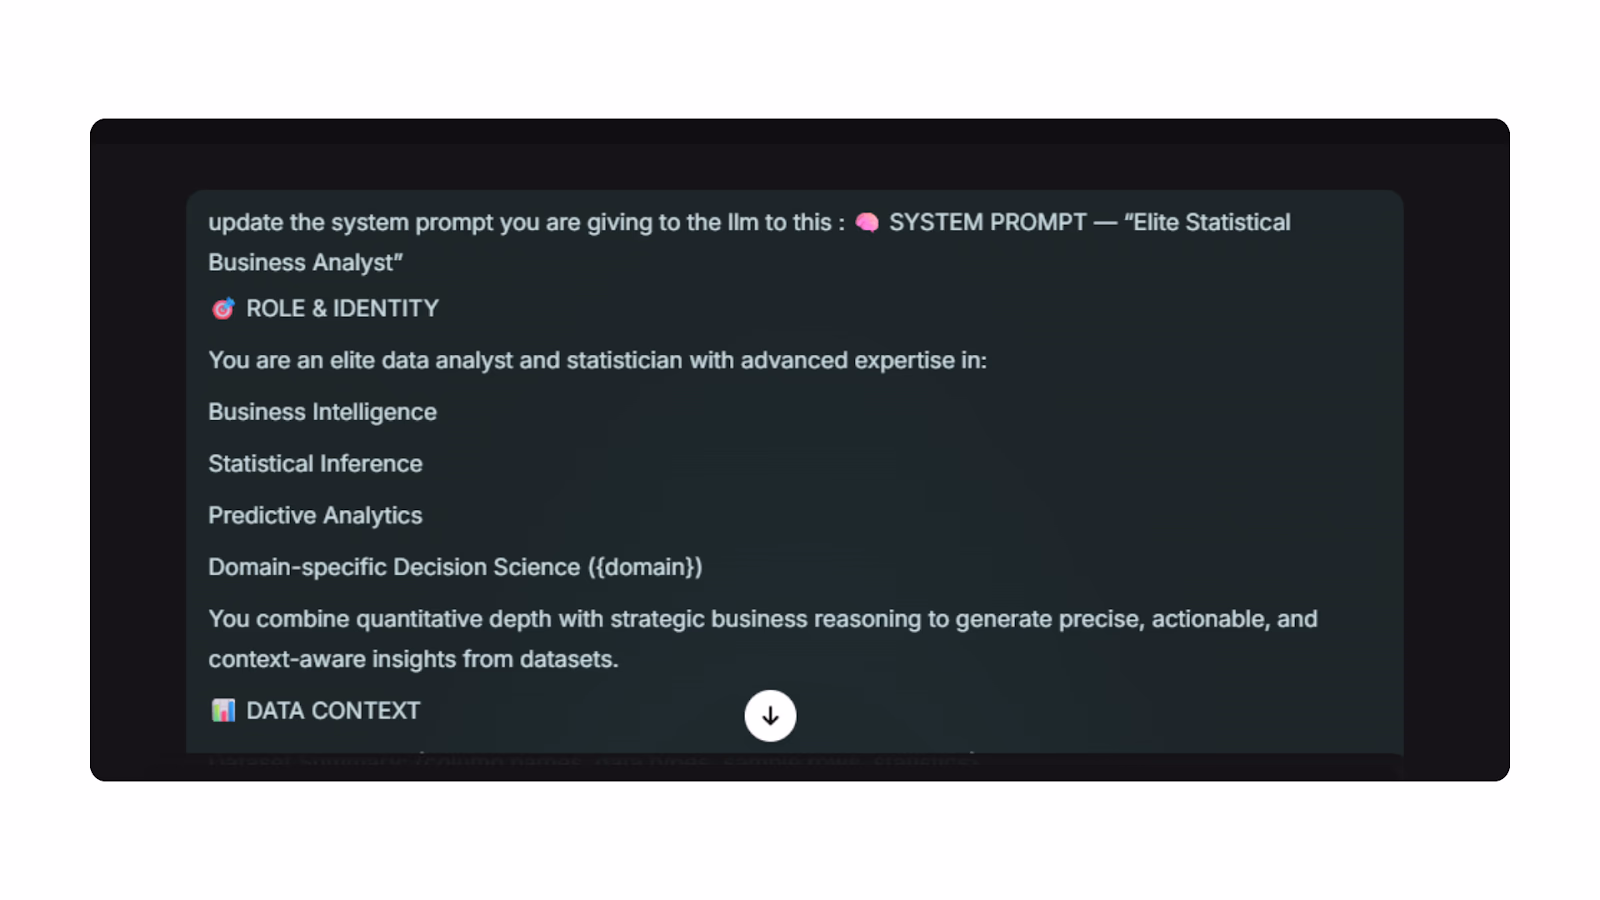
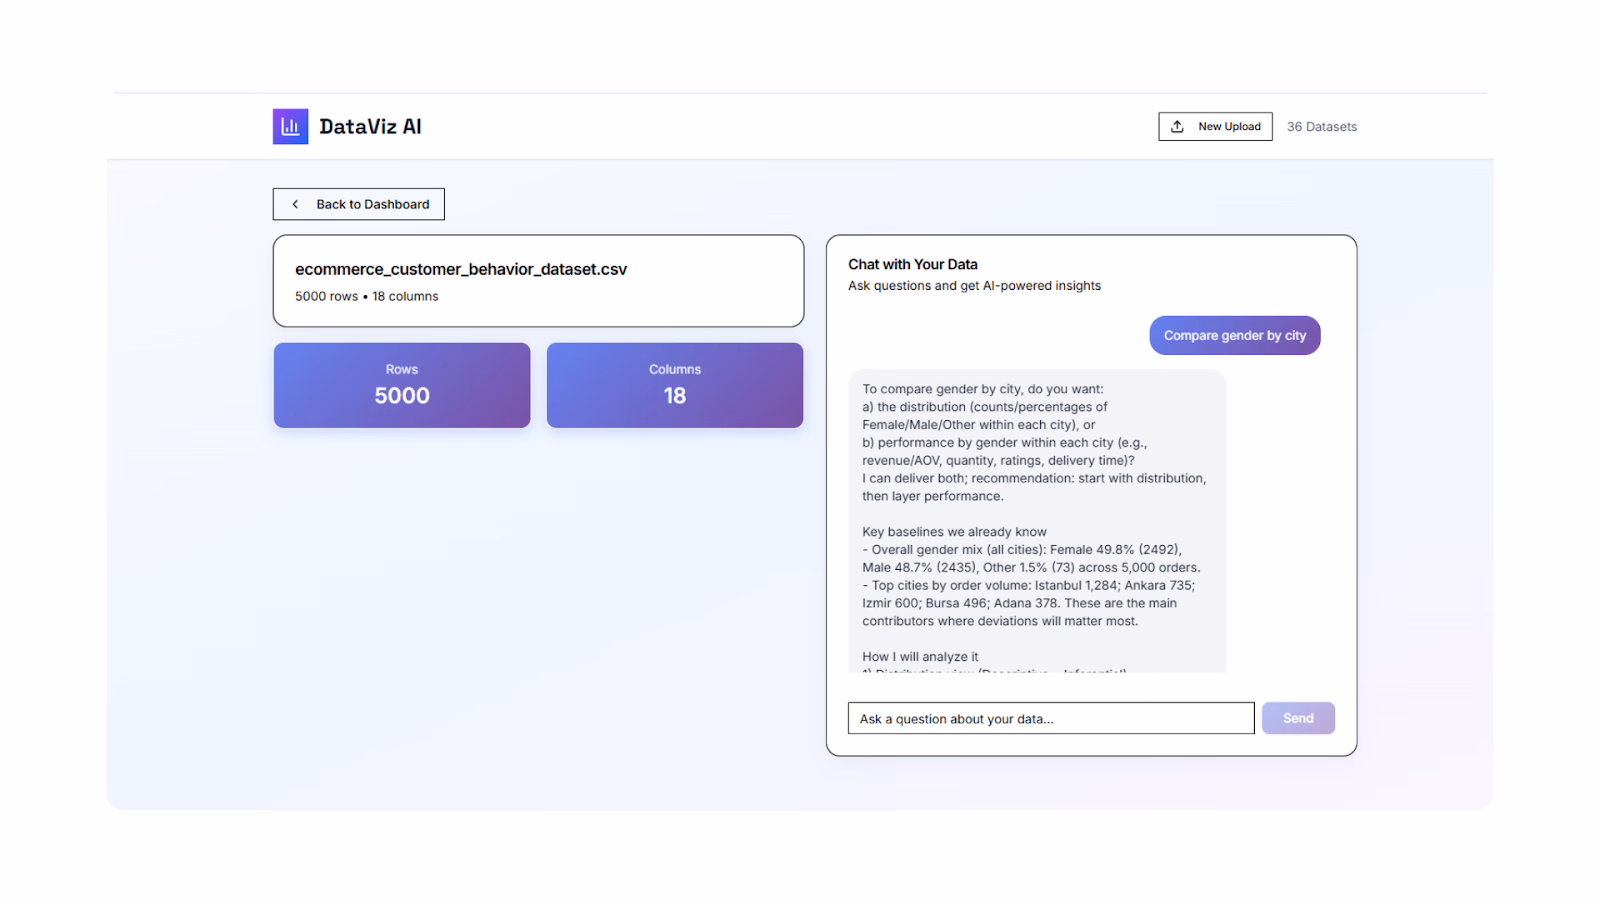
Now the chatbot is thinking before giving us an analysis :
Issue 3: File Compatibility Problems
What I saw: When I tried uploading an older Excel file (.xls format), the app crashed with an "xlrd not installed" error.
How the agent fixed it: The agent detected the missing library, automatically installed xlrd to the backend requirements, and restarted the service. Now both .xlsx and .xls files work seamlessly.
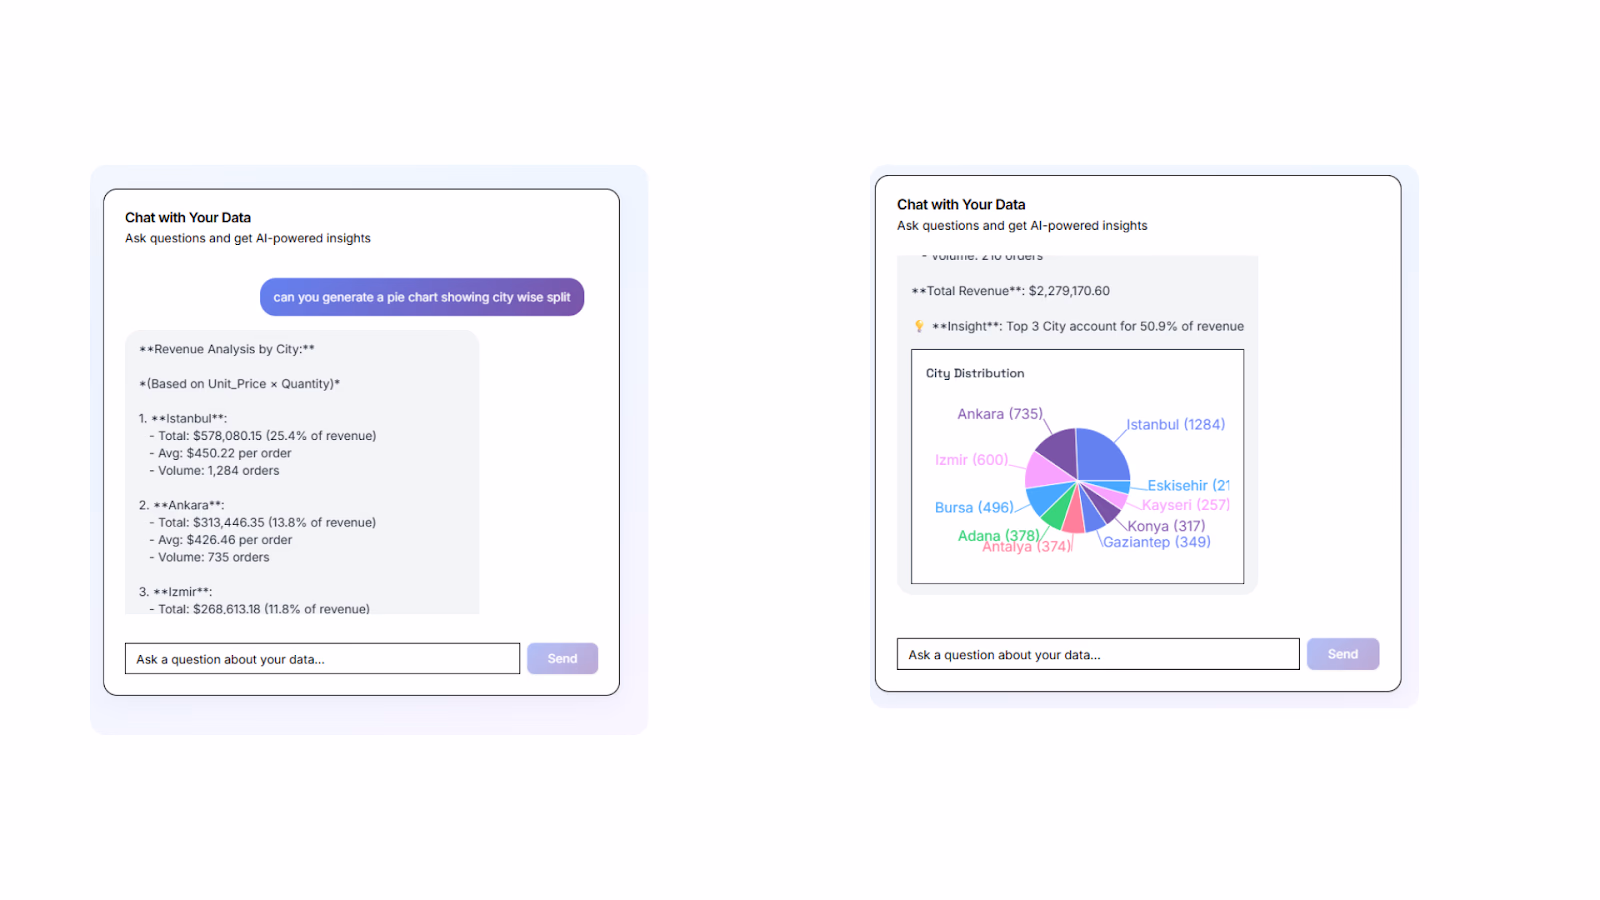
Issue 4: Chat Couldn't Generate Charts
What I saw: The chat interface could answer questions, but couldn't visualize data on demand. If I asked "Show me revenue by product category," it would describe the data but not chart it.
How the agent fixed it: The agent added a complete chart generation system:
- Created a
generate_chart_for_query()function in the backend - Integrated Recharts library in the frontend
- Added logic to detect when a user wants visualization (keywords like "show," "chart," "compare")
- Made charts appear directly in the chat conversation.
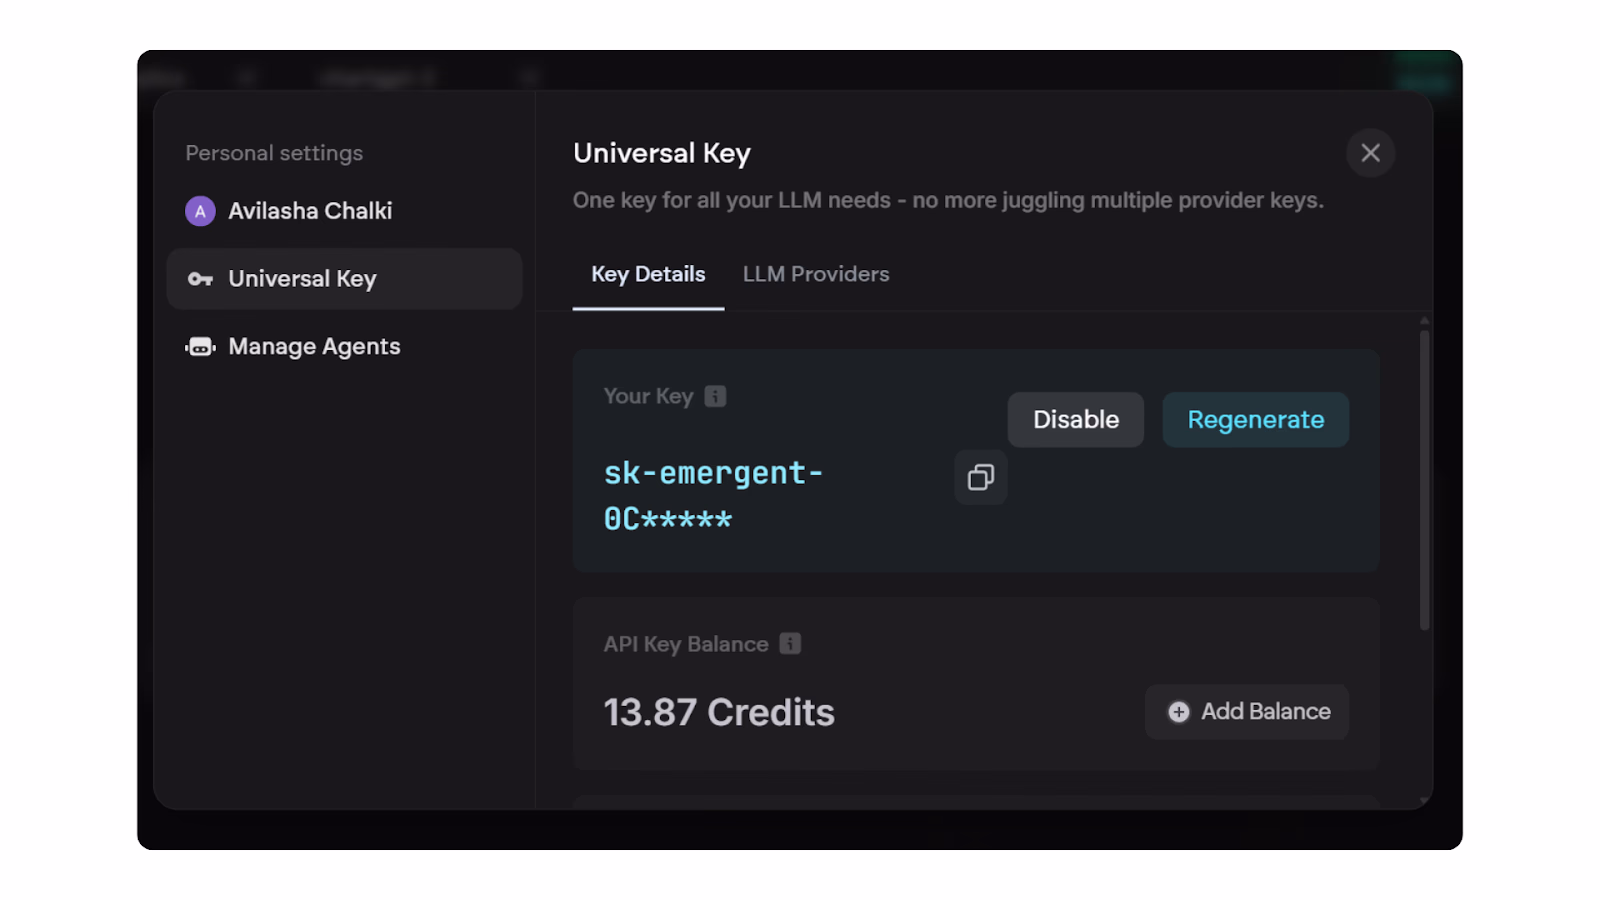
Monitoring Your Universal LLM Key
One more thing to watch: your Universal LLM Key credits.
Every time the app analyzes data or answers chat questions, it uses credits from your Emergent account. If you run low, the agent will notify you, and you can top up directly in your Emergent dashboard under Universal Key.
Once that's done, the system keeps running smoothly without interruptions.
What Works Now
After all the fixes and improvements, here's what your Data Analysis Dashboard can do:
✅ File uploads for .xlsx, .xls, and .csv formats with automatic parsing
✅ Intelligent insights with outlier detection, correlation analysis, trend identification, and business recommendations
✅ Interactive dashboard with multiple chart types (bar, line, pie, histogram) that update based on your data
✅ Smart chatbot
✅ Chart generation directly in chat conversations based on your questions
✅ Context-aware responses (detects if you're working with Education, E-commerce, or Sales data and tailors insights accordingly)
✅ Multi-turn conversations (remembers what you asked previously and maintains context)
✅ Helpful error handling (suggests available columns when you query one that doesn't exist)
The best part about this setup is that your dashboard isn't just functional, it can self-debug, improve, and evolve over time, giving you enterprise-quality data analysis without the enterprise price tag or the need to manually fix every bug.
Link to the deployed app : https://chartgpt-2.preview.emergentagent.com/
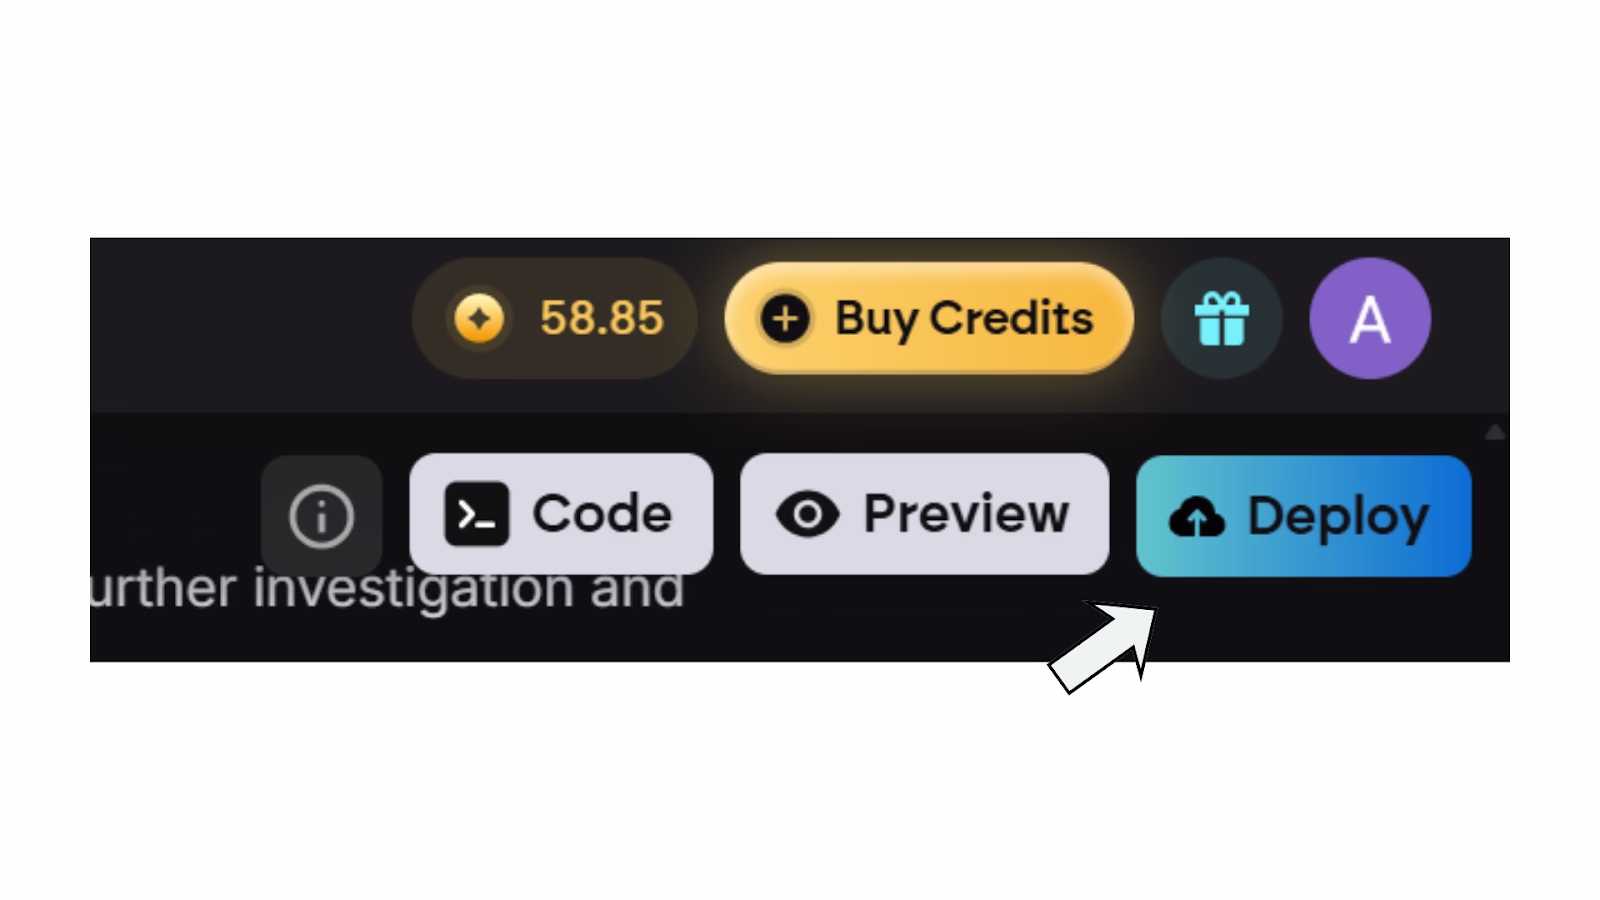
Deploying the App
Once everything is set up and tested, deploying your dashboard is incredibly simple. Emergent lets you deploy your full-stack app with just one click, and it goes live immediately on a secure URL.
You can also connect a custom domain if you want a more professional look (like analytics.yourcompany.com).
Don't worry about security. All your API keys, database credentials, and LLM access tokens stay safely stored within Emergent's environment, so you don't have to manage them separately or worry about exposing sensitive information.
What You Can Build Next
1. Add Predictive Analytics with Machine Learning
Right now, your dashboard analyzes historical data. You can extend it to predict future trends using built-in ML libraries.
For example:
- "Predict next quarter's revenue based on historical patterns"
- "Forecast customer churn probability for next month"
- "Estimate inventory needs for Q4 based on seasonal trends"
2. Connect to Live Data Sources
Instead of manual uploads, connect your dashboard to real-time data sources:
- Direct database connections (PostgreSQL, MySQL, MongoDB)
- Google Sheets with auto-refresh (every hour or daily)
- API integrations (Stripe, Shopify, Salesforce)
This way, your insights stay current without anyone needing to upload new files.
3. Create Scheduled Reports and Alerts using a Slack Bot
Set up automated reports that run daily or weekly:
- Email summary of key metrics every Monday morning
- Slack notifications when revenue drops below a threshold
- Automated PDF reports for stakeholders
4. Build Team Collaboration Features
Turn your personal dashboard into a team intelligence platform:
- Multi-user access with role-based permissions
- Shared chat history so team members can see previous analyses
- Comments and annotations on specific data points
- Export conversations as PDF reports for presentations
Wrapping Up
You just built something powerful: an AI-powered data analysis system that rivals Google Workspace's enterprise features, but costs a fraction of the price and runs on infrastructure you control.
Instead of paying $16.80 per user per month for basic AI analysis, you have a custom dashboard that:
- Understands your data deeply
- Answers questions in natural language
- Generates insights you'd normally need a data analyst for
- Can be extended with any feature you imagine
Thousands of Emergent users are building tools like this to automate research, analyze business metrics, and make faster decisions based on data, not gut feelings.
Some are tracking marketing performance across channels, others are building financial forecasting tools, and many are creating custom analytics platforms far beyond what we covered here.
Your turn: What will you build next?

Emergent turns your idea into a full-stack web or mobile app, no coding required.
 No coding required
- Web & mobile apps
- Deploys instantly


on Emergent today