Building an Enterprise Field Force Management Platform
A field force analytics dashboard that lets sales managers monitor 50+ personnel across 8 territories, extract competitive intelligence from visit discussions, and generate AI-powered strategic insights, with GPS tracking, PDF exports, and data persistence handled automatically end to end.


Introduction
Field force management looks simple on the surface.
Track visits. Monitor performance. Generate reports.
But once you start building it, you quickly run into hard problems: real-time data aggregation, competitive intelligence extraction, GPS coordinate handling, AI-powered insights, multi-dimensional filtering, data persistence without a database, and dashboards that non-technical managers can actually understand.
This project documents the journey of building a comprehensive field force analytics platform where sales managers can monitor 50+ field personnel across 8 territories, analyze 550+ visits, identify competitive threats, and get AI-powered strategic recommendations, all through a single, intuitive dashboard.
Unlike many analytics tools that require complex backend infrastructure and expensive databases, this app was designed with a clear constraint:
All data must persist locally using browser localStorage, requiring zero backend for demo purposes, while maintaining production-ready architecture.
This implementation walks through how intelligent mock data generation, real-time filtering, AI integration (Claude), cloud storage (Supabase), email notifications (Resend), interactive mapping (Leaflet), and PDF exports were planned, built, debugged, and polished into a production-ready MVP.
Problem Statement and Proposed Solution
The Problem
Field force management products often suffer from:
- Heavy infrastructure dependencies and deployment complexity
- No offline capability or local data persistence
- Generic dashboards that don't answer strategic questions
- Weak competitive intelligence extraction from unstructured data
- Slow AI integrations that block the entire UI
- Chart libraries that don't match brand design systems
- Monolithic components that become unmaintainable
- PDF exports that look like printer receipts, not business reports
- No territory-level insights or route optimization
- Expensive per-seat pricing that kills adoption
For builders, this means shipping something that works in the demo but falls apart when managers need real answers about competitor threats, route efficiency, or personnel performance at 7 AM on a Monday.
The Solution
This field force app flips the model.
Data lives in the browser, not behind authentication walls.Intelligence is extracted from discussions, not manual tags.AI enhances decisions without blocking the workflow.Exports are designed for boardrooms, not printers.
The solution combines:
- An intelligent localStorage persistence engine
- AI-powered competitive intelligence extraction
- Multi-dimensional real-time analytics
- Interactive GPS route visualization
- Strategic insights generation via Claude AI
- Professional PDF exports for all modules
- Modular React hooks for clean architecture
- Email notifications and cloud photo storage
- Market share trend analysis over time
- Visit scheduling with automatic persistence
The result is a production-ready analytics platform that works even without a backend database, gives managers strategic answers in seconds, and scales from demo to deployment without architectural rewrites.
Learning Outcomes
By completing this tutorial, you'll learn localStorage-based persistence, competitive intelligence extraction, non-blocking AI integration, real-time analytics dashboards, PDF report generation, custom React hooks, GPS visualization with Leaflet, third-party integrations (Claude AI, Supabase, Resend), chart optimization for 500+ data points, user-friendly dashboard design, state synchronization debugging, and shipping a complete analytics MVP.
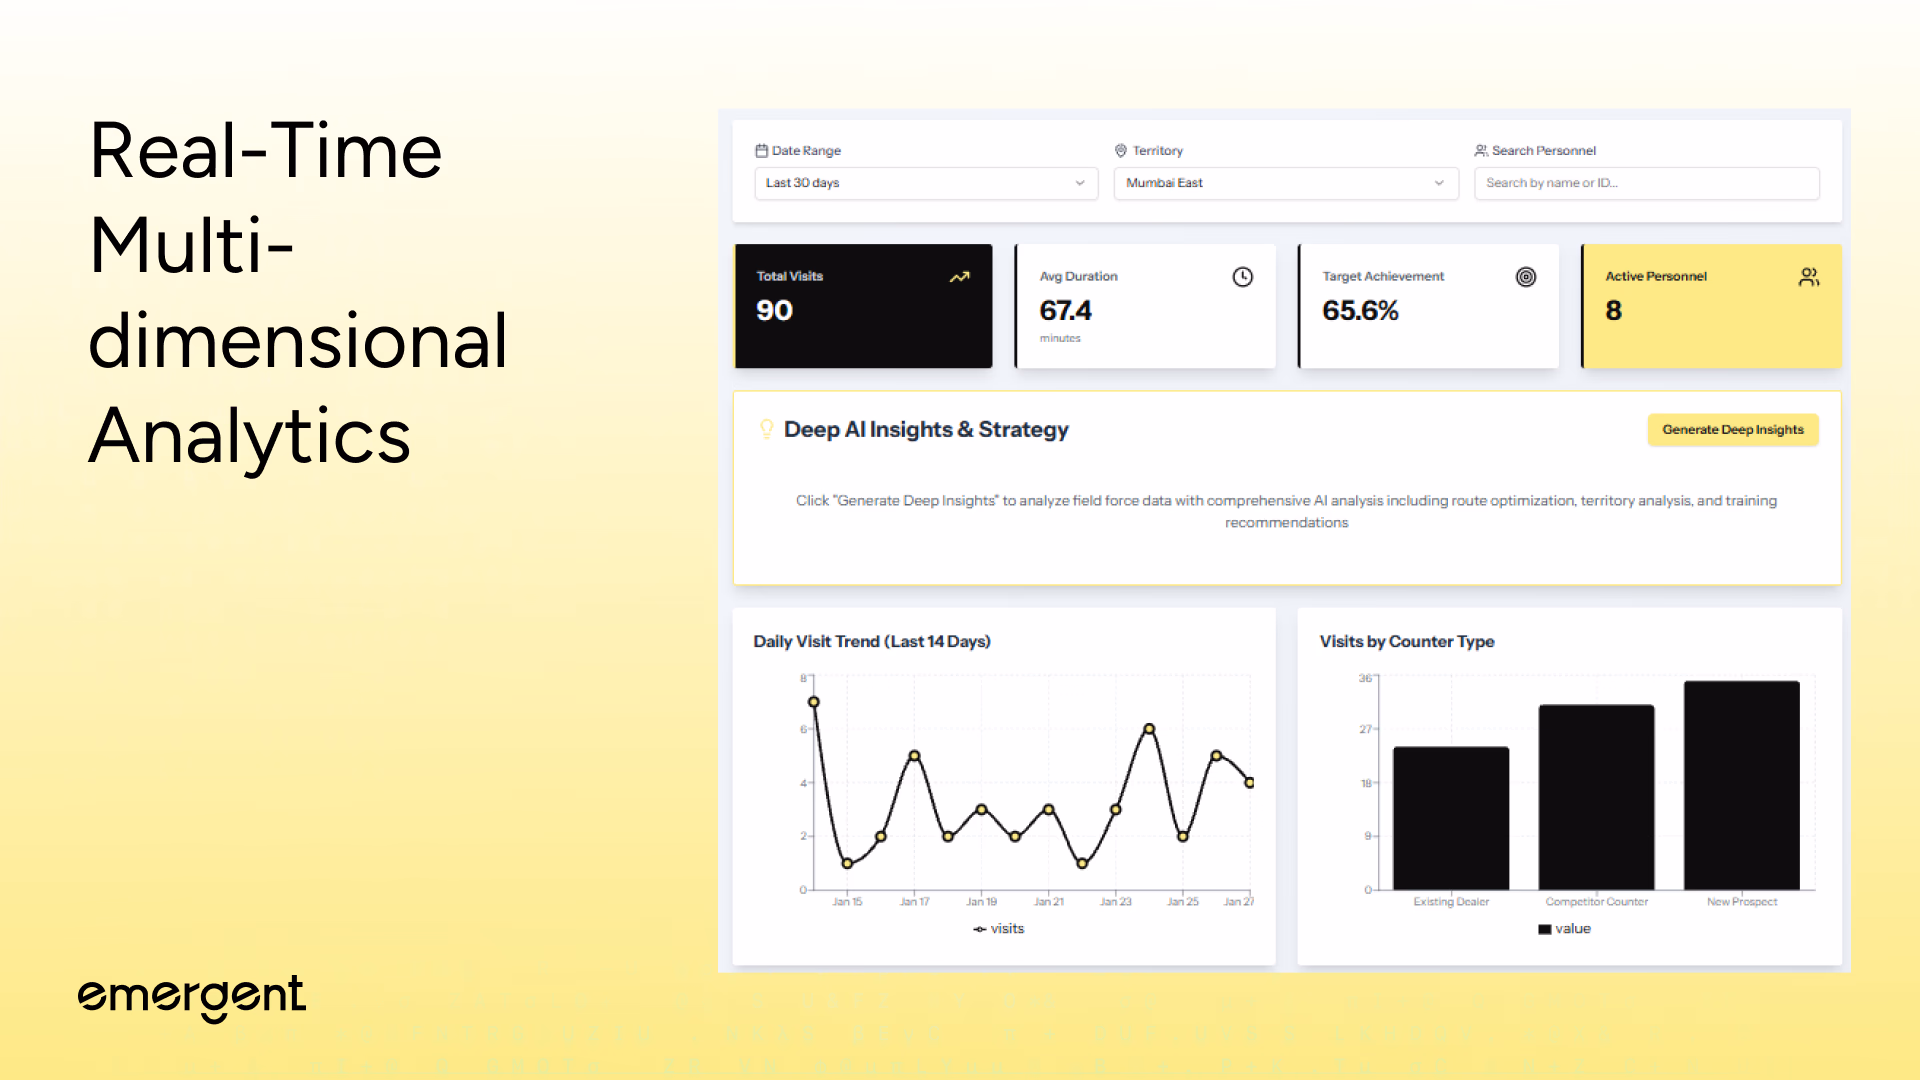
Step 1: Real-Time Multi-Dimensional Analytics
Managers can monitor field force performance across 50 personnel and 8 territories, refining insights using filters such as:
- Date Range (Last 7, 14, or 30 days with dropdown selector)
- Territory (Mumbai West, Mumbai East, Pune, Nashik, Aurangabad, Nagpur, Thane, Navi Mumbai)
- Personnel Search (search by agent name or ID with live autocomplete)
- Counter Type (Existing Dealer, Competitor Counter, New Prospect)
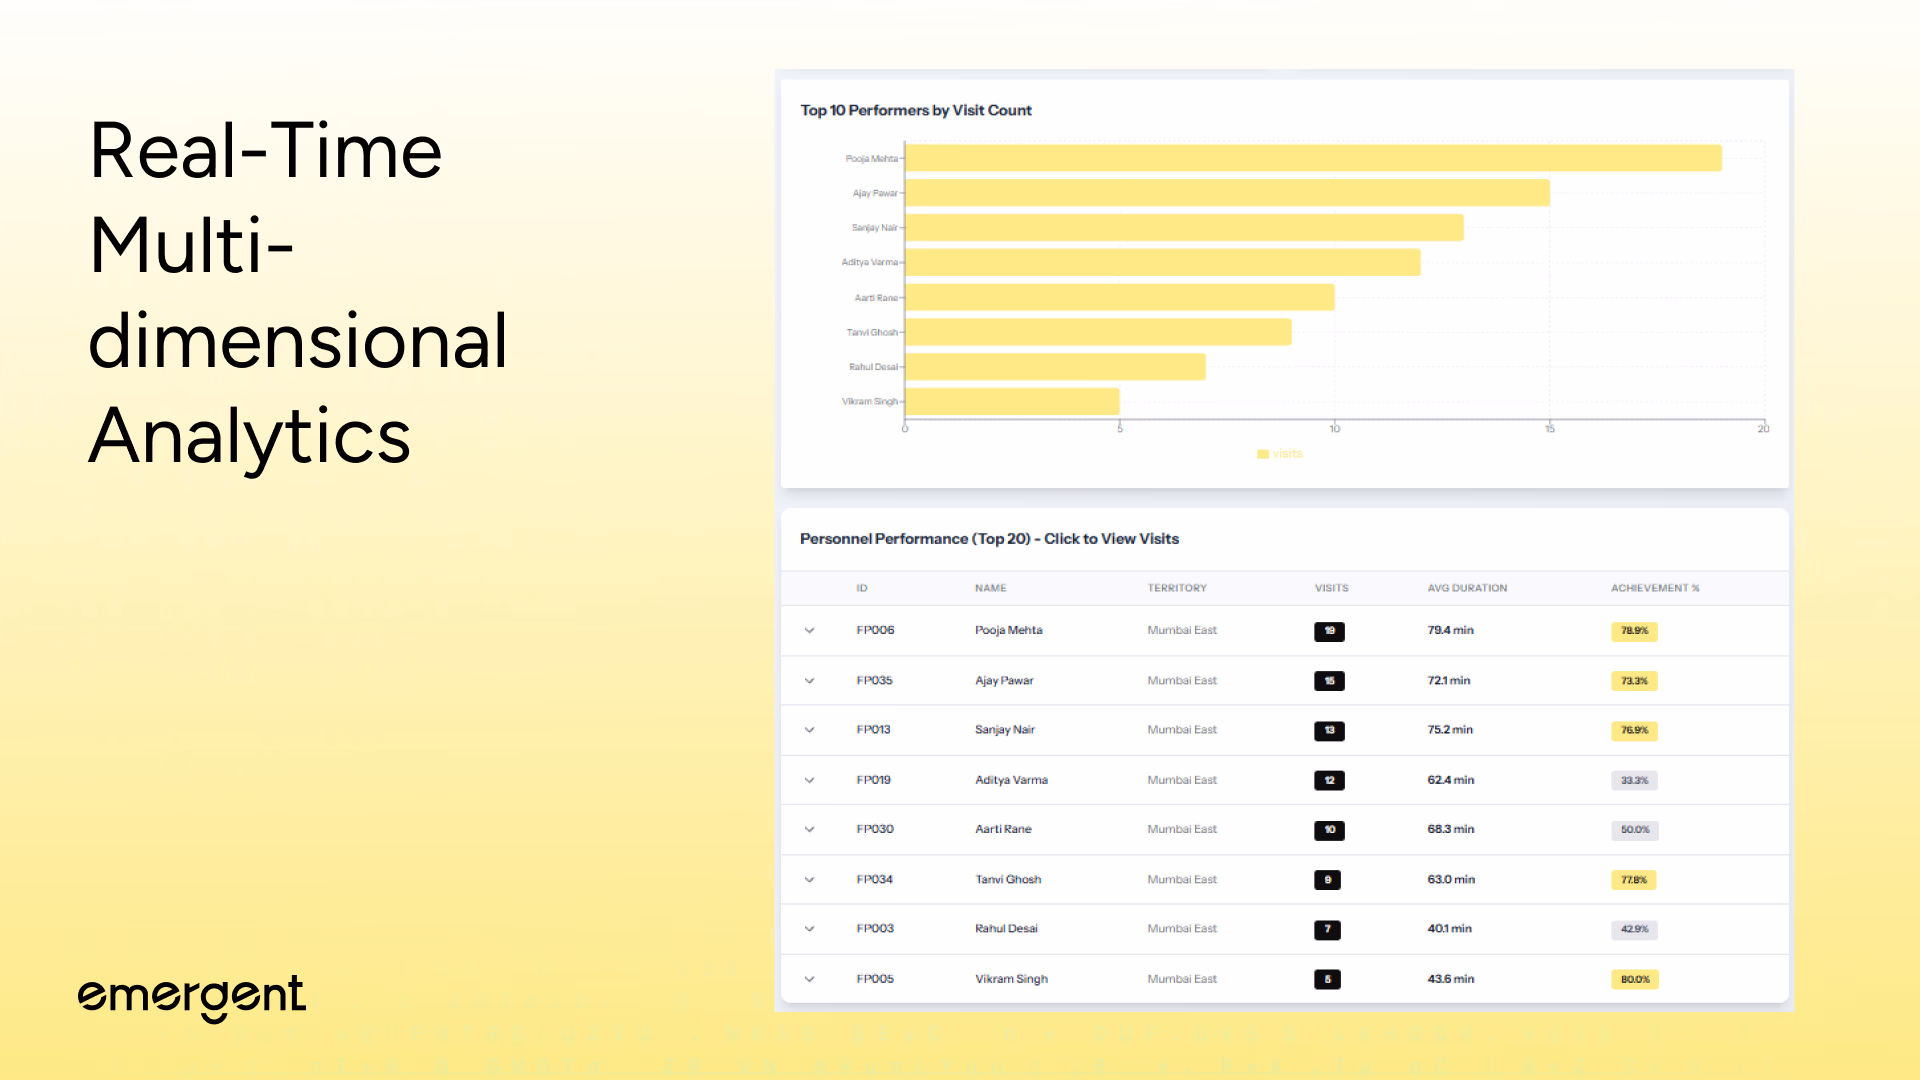
- Achievement Level (color-coded badges on table rows: >70% highlighted in yellow)
- Visit Count (sortable column for identifying top and bottom performers)
- KPI cards update instantly as filters change, showing Total Visits, Average Duration, Target Achievement %, and Active Personnel.
- Interactive charts redraw in real-time, daily trend lines, counter type breakdowns, and top performer rankings all respond to filter selections without page reloads.
- Personnel table rows are expandable, revealing individual visit histories with GPS coordinates, discussion notes, and target achievement status for each encounter.
- All 550+ visits are processed client-side using optimized useMemo hooks, delivering sub-second filter responses even on mid-range devices.
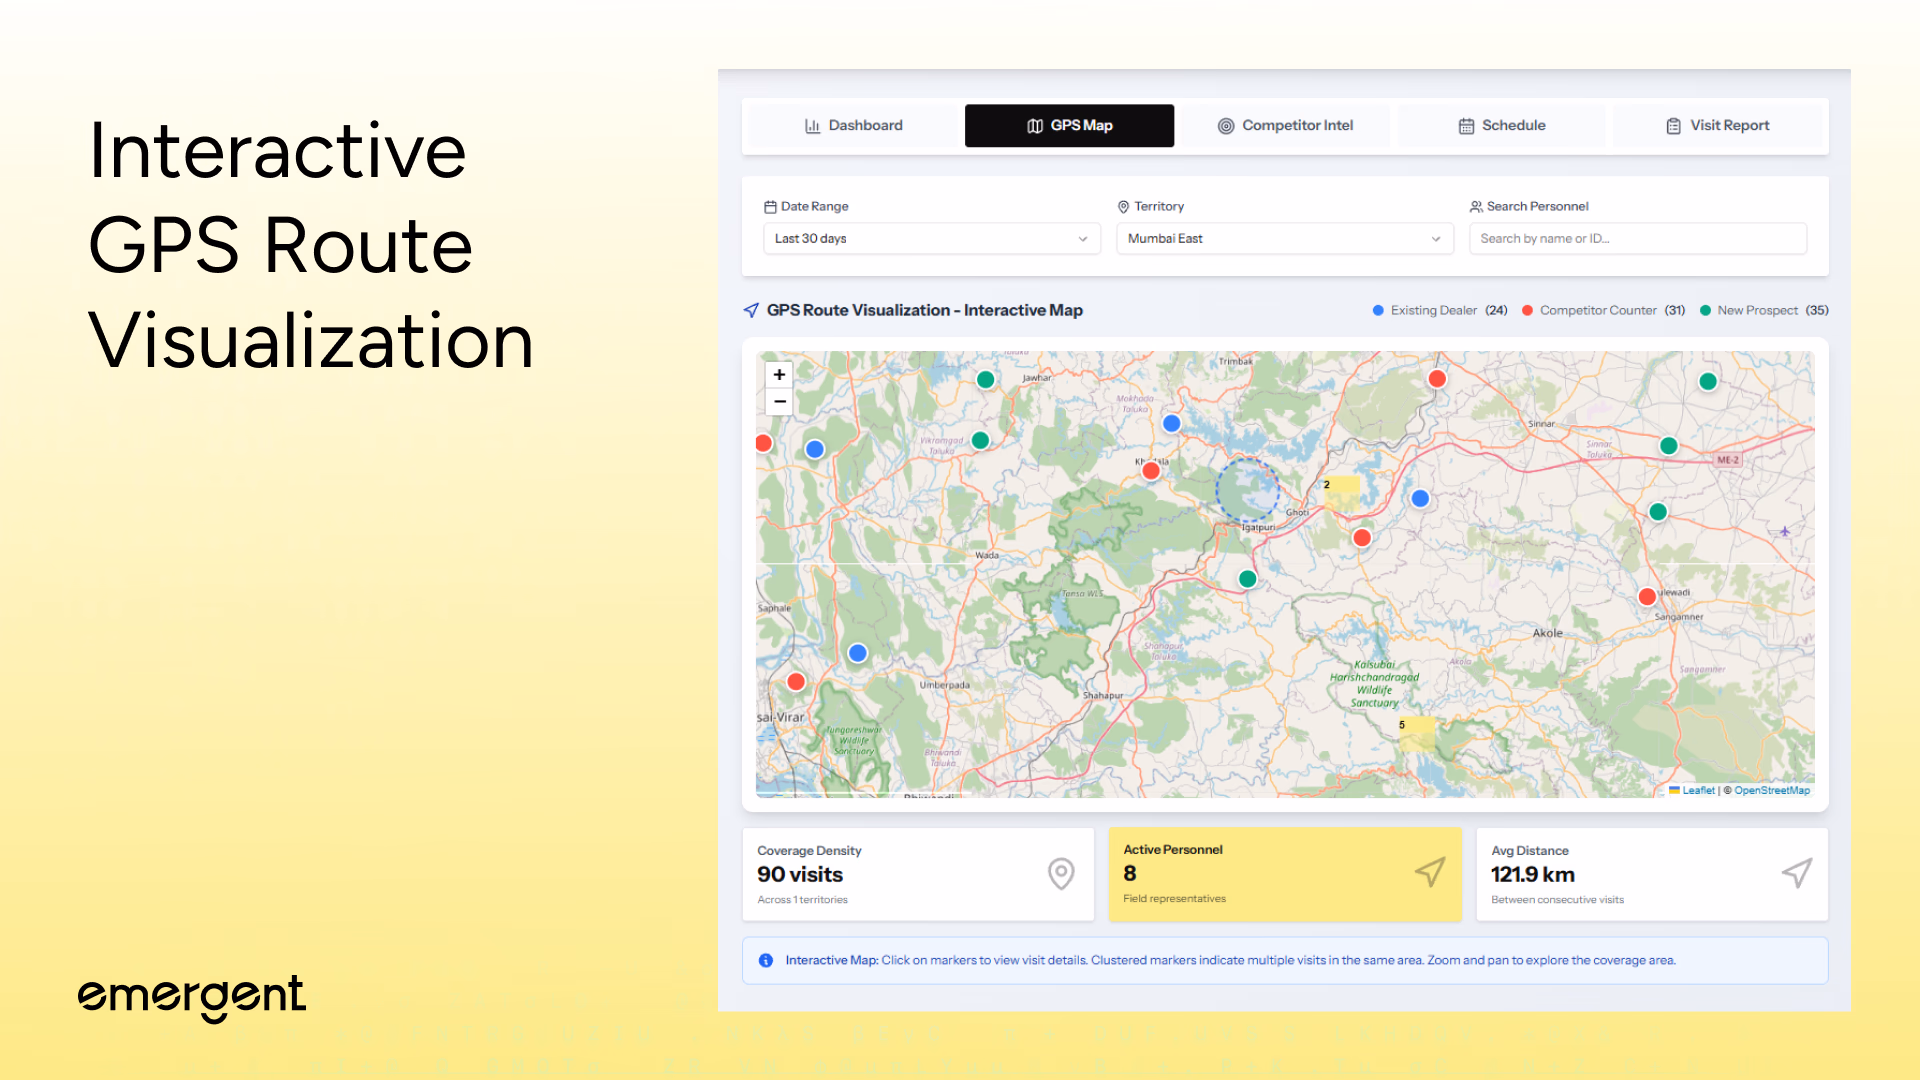
Step 2: Interactive GPS Route Visualization
Managers track field force movements across Mumbai with precise GPS coordinates via an interactive map featuring:
- Visit Markers - 550+ pins showing exact locations with lat/long coordinates
- Marker Clustering - Automatic grouping of nearby visits to prevent clutter at zoom-out
- Territory Boundaries - Color-coded regions for all 8 territories with overlay highlighting
- Visit Details on Click - Popup cards with personnel name, date, time, duration, counter type, notes
- Date Range Filtering - Map syncs with dashboard filters (last 7/14/30 days)
- Personnel Filtering - Isolate routes for specific agents to analyze coverage patterns
- Counter Type Icons - Visual distinction between Existing Dealer, Competitor Counter, New Prospect
- Cluster Expansion - Markers display visit counts and expand on click to reveal individual pins with full metadata
- Heat Map Overlays - Show visit concentration to identify over-serviced and under-serviced areas
- Client-Side Processing - React-Leaflet delivers instant map updates when filters change without backend queries
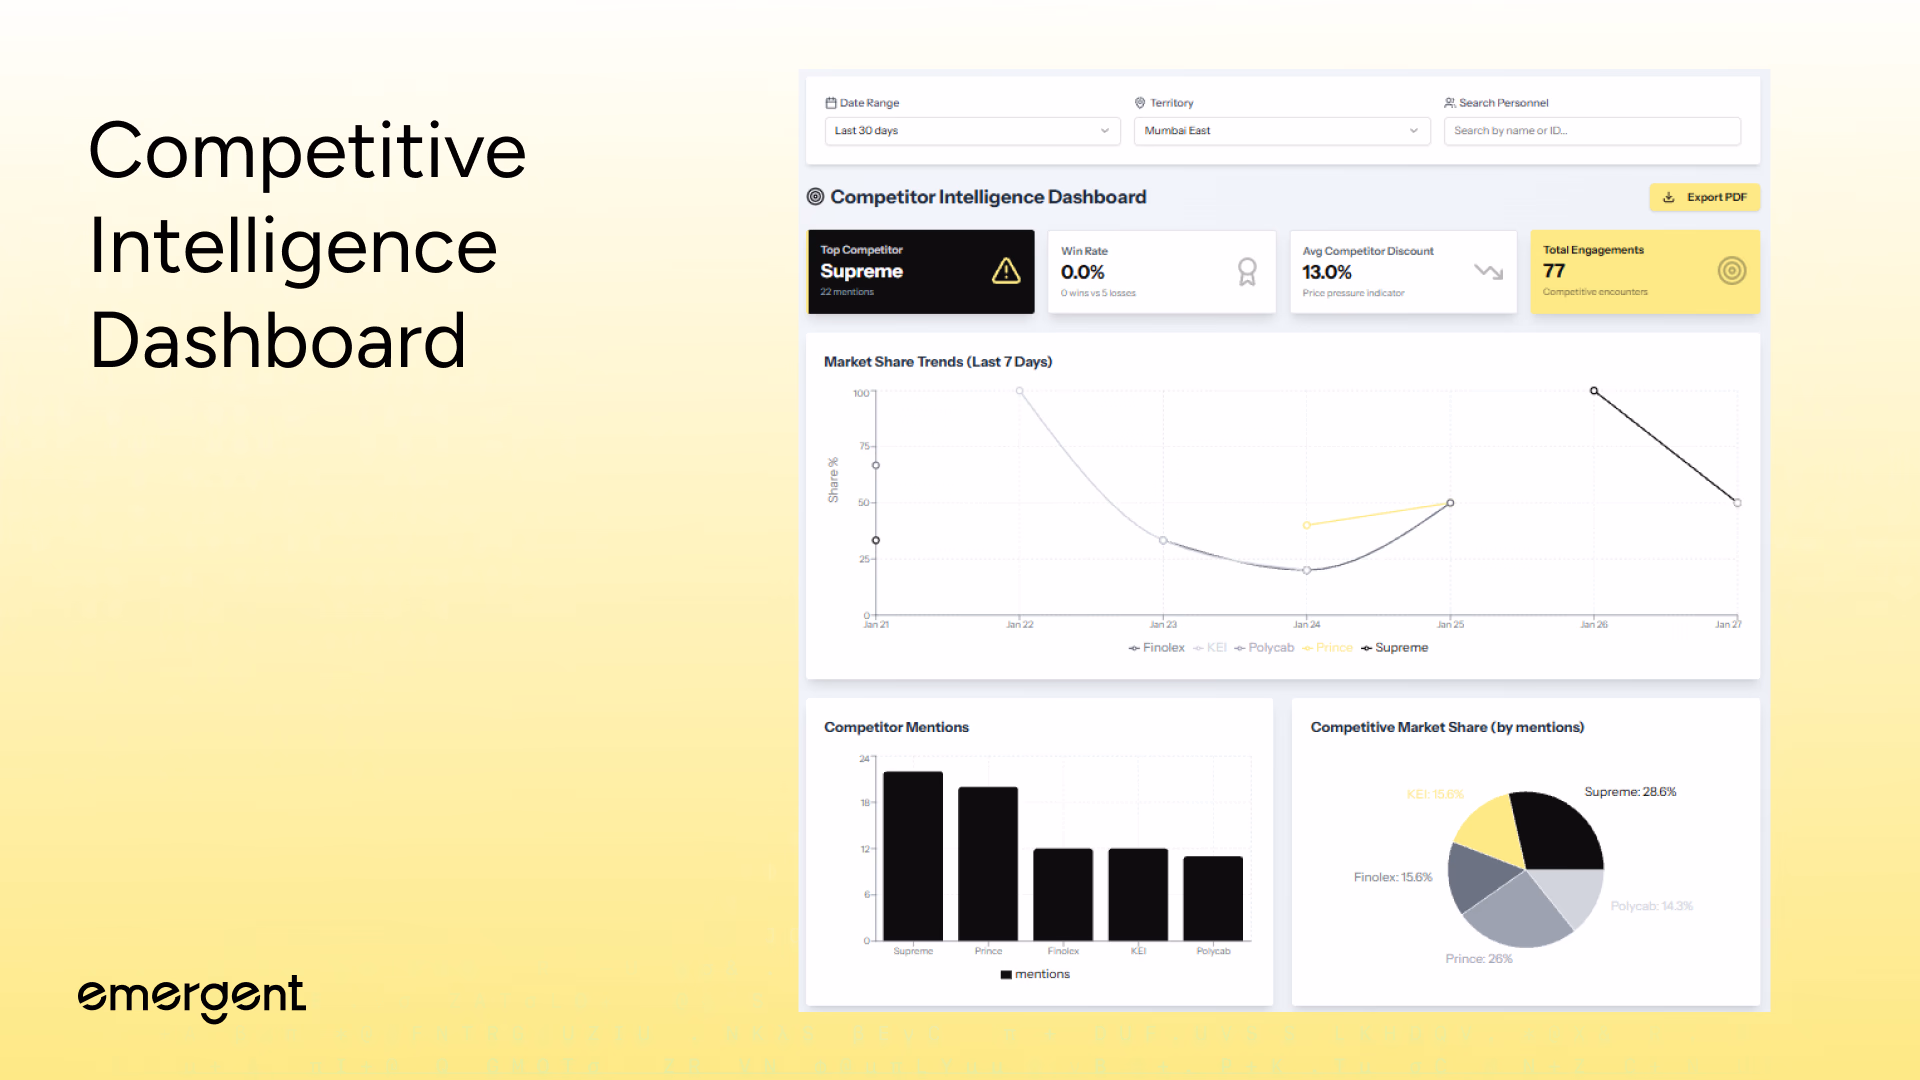
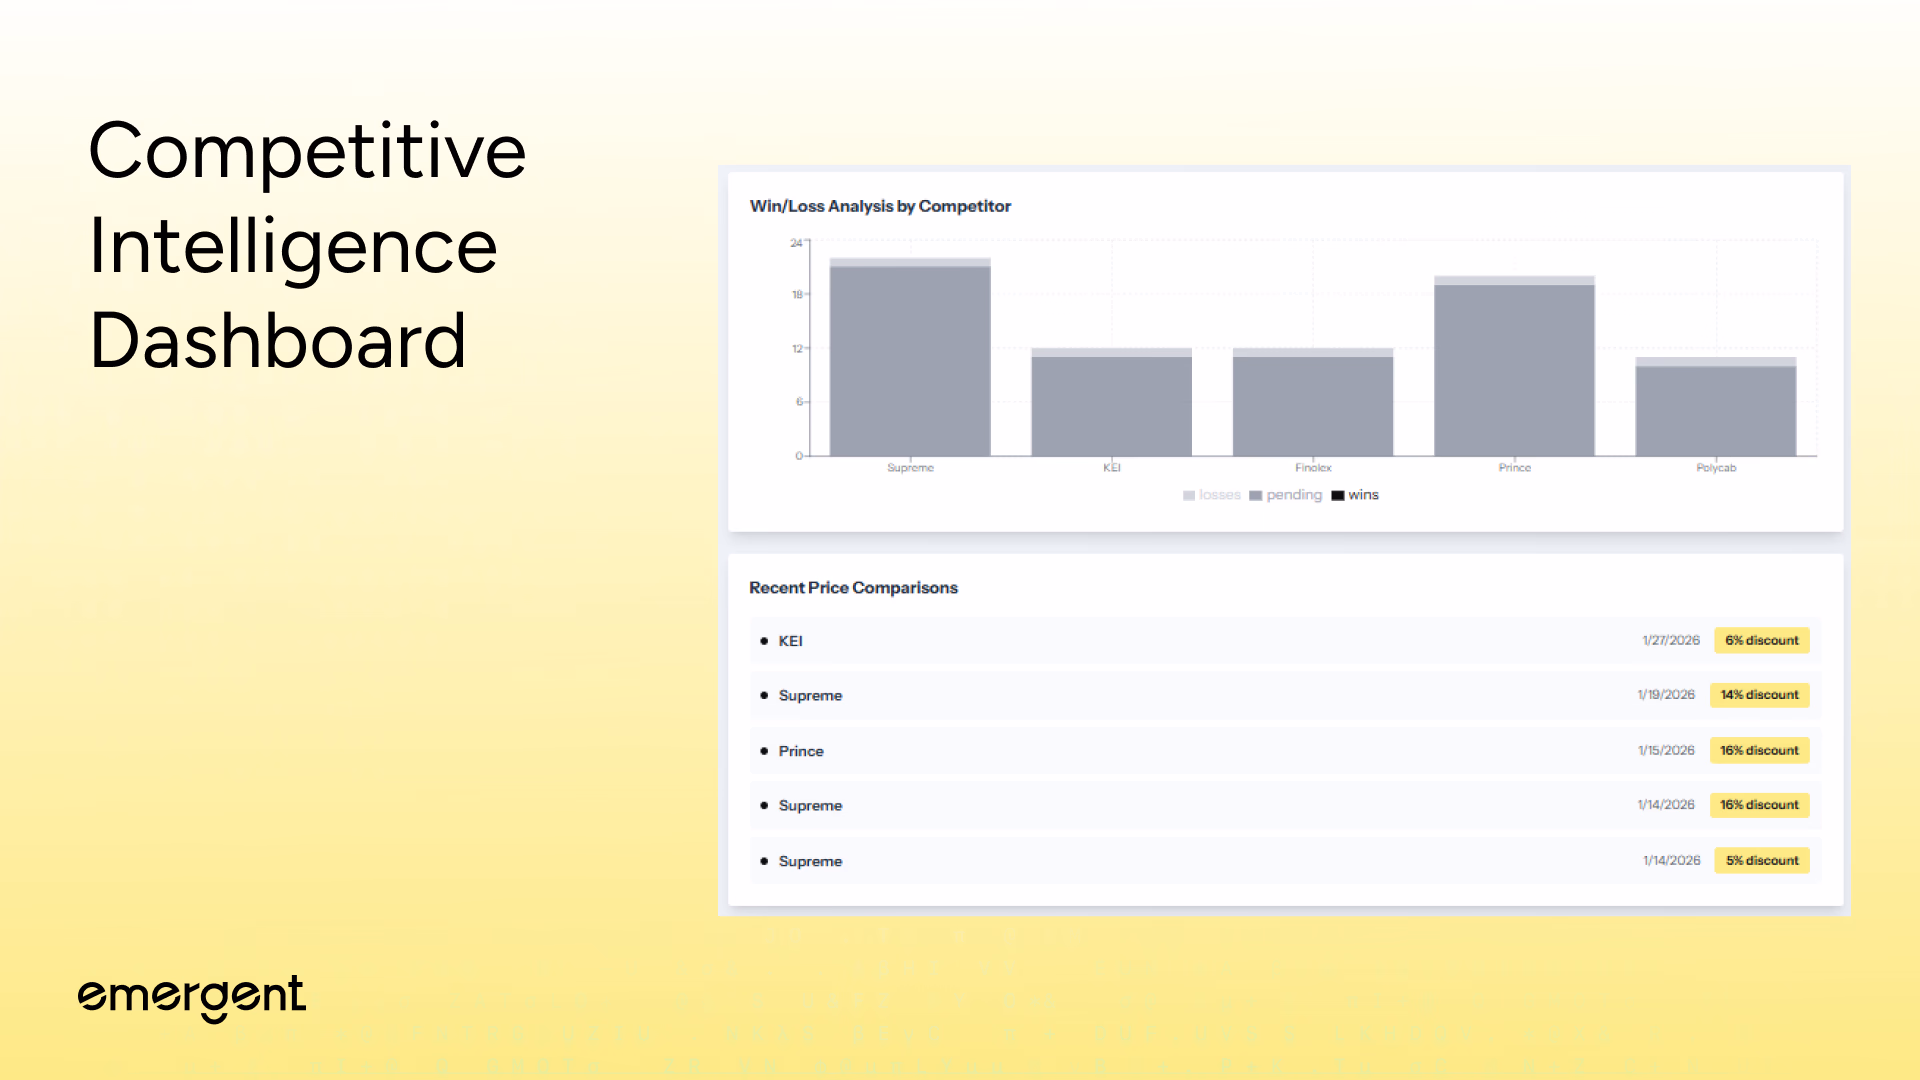
Step 3: Competitive Intelligence Dashboard
Managers track competitor activities across all field visits with automated intelligence extraction, analyzing competitive threats using:
- Competitor Mentions - Automatic detection of Supreme, Prince, Finolex, Polycab, KEI in discussion notes across 550+ visits
- Market Share Trends - 7-day multi-line chart showing each competitor's positioning evolution over time
- Win/Loss Ratios - Stacked bar charts displaying wins, losses, and pending encounters by competitor
- Price Pressure Analysis - Regex extraction of discount percentages from conversations with average competitor discount calculation
- Top Competitor Identification - Highlighted metric card showing highest-mentioned competitor with alert icon
- Client-Side NLP - useMemo hooks parse discussion text patterns and aggregate metrics without backend services or API costs
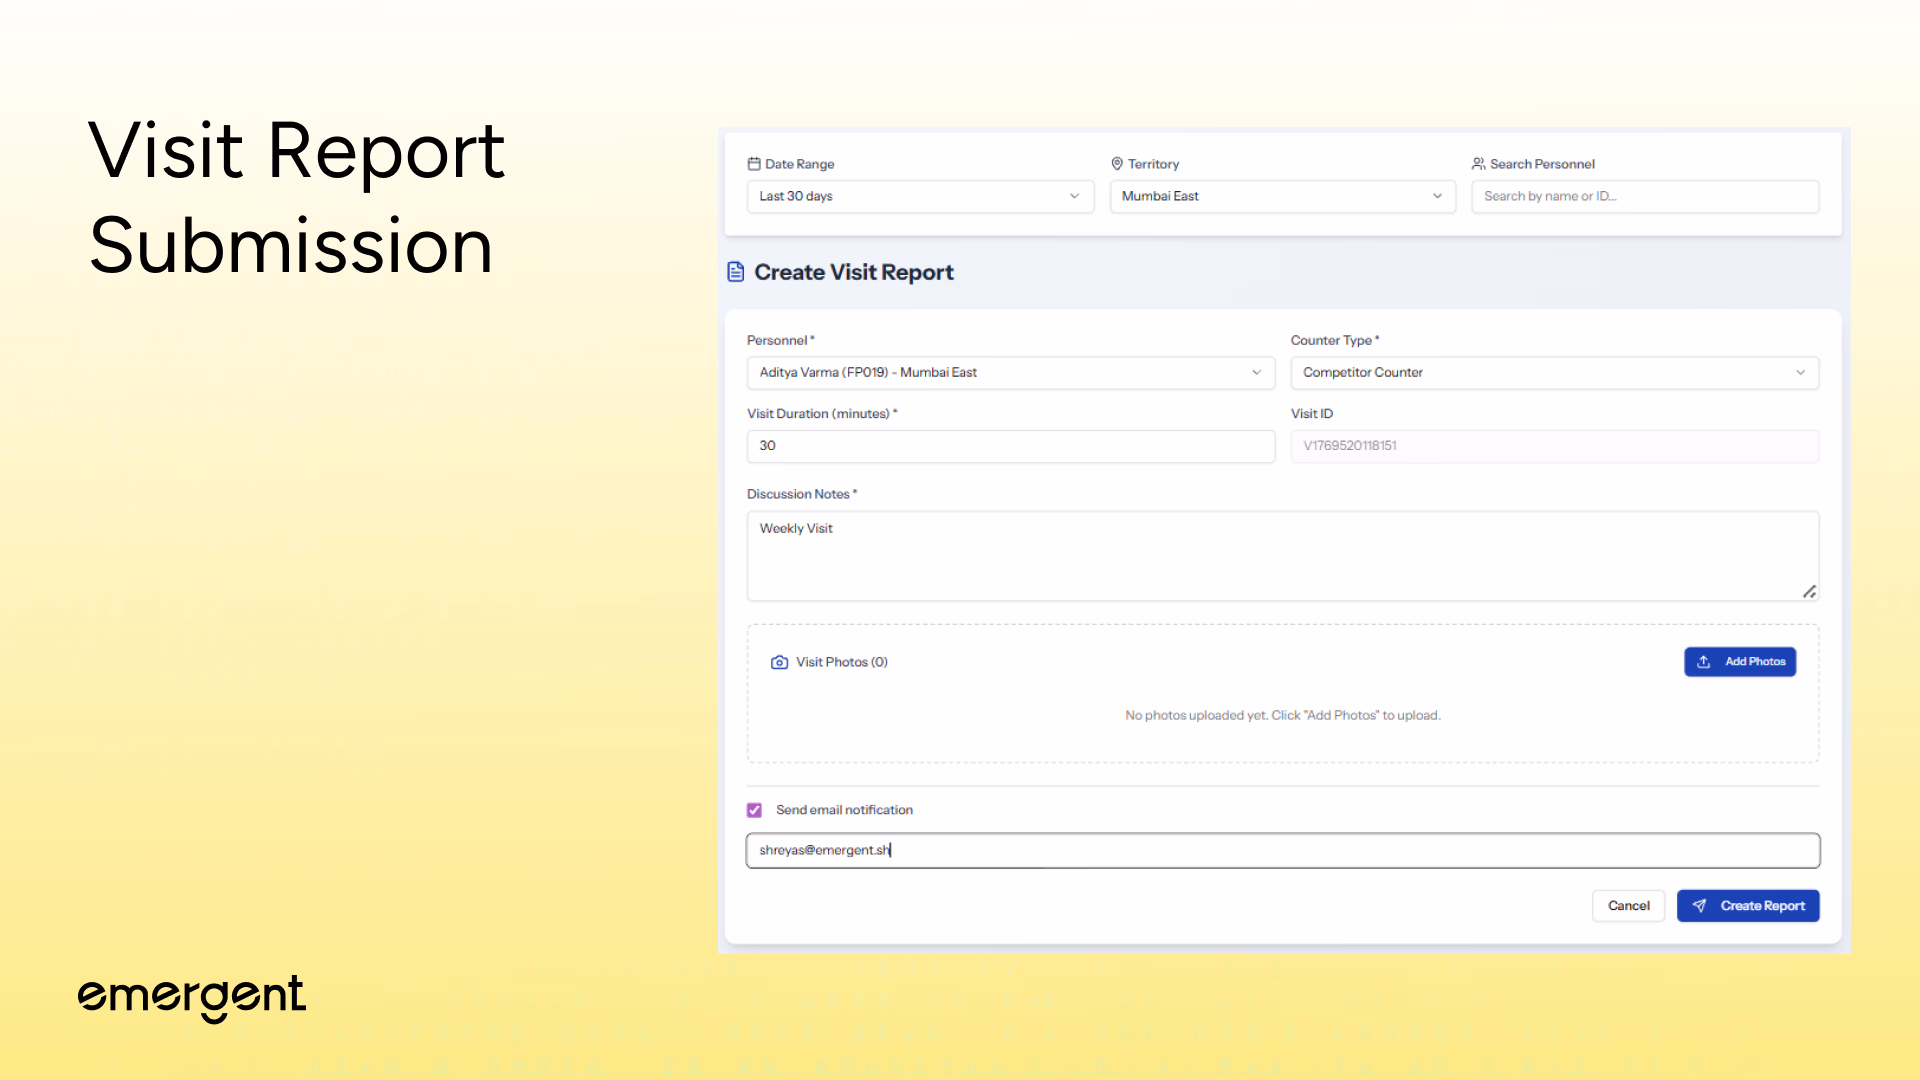
Step 4: Visit Report Submission
Field personnel document completed visits with comprehensive reports including photo evidence, capturing critical encounter data using:
- Auto-Generated Visit IDs - Unique timestamp-based identifiers for each report with format V{timestamp}
- Personnel & Classification - Dropdown with all 50 agents plus radio selection for Existing Dealer, Competitor Counter, or New Prospect
- Duration & Discussion - Numeric input (1-300 minutes) with expandable textarea for detailed conversation summaries and outcomes
- Multi-Photo Upload - Up to 5MB per image with drag-and-drop support for JPEG, PNG, WebP formats
- Supabase Cloud Storage - Photos uploaded with unique file paths organized by personnel ID and visit ID, generating public URLs
- Email Notifications - Resend API delivers HTML emails with embedded photo thumbnails, visit metadata, and discussion excerpts to management
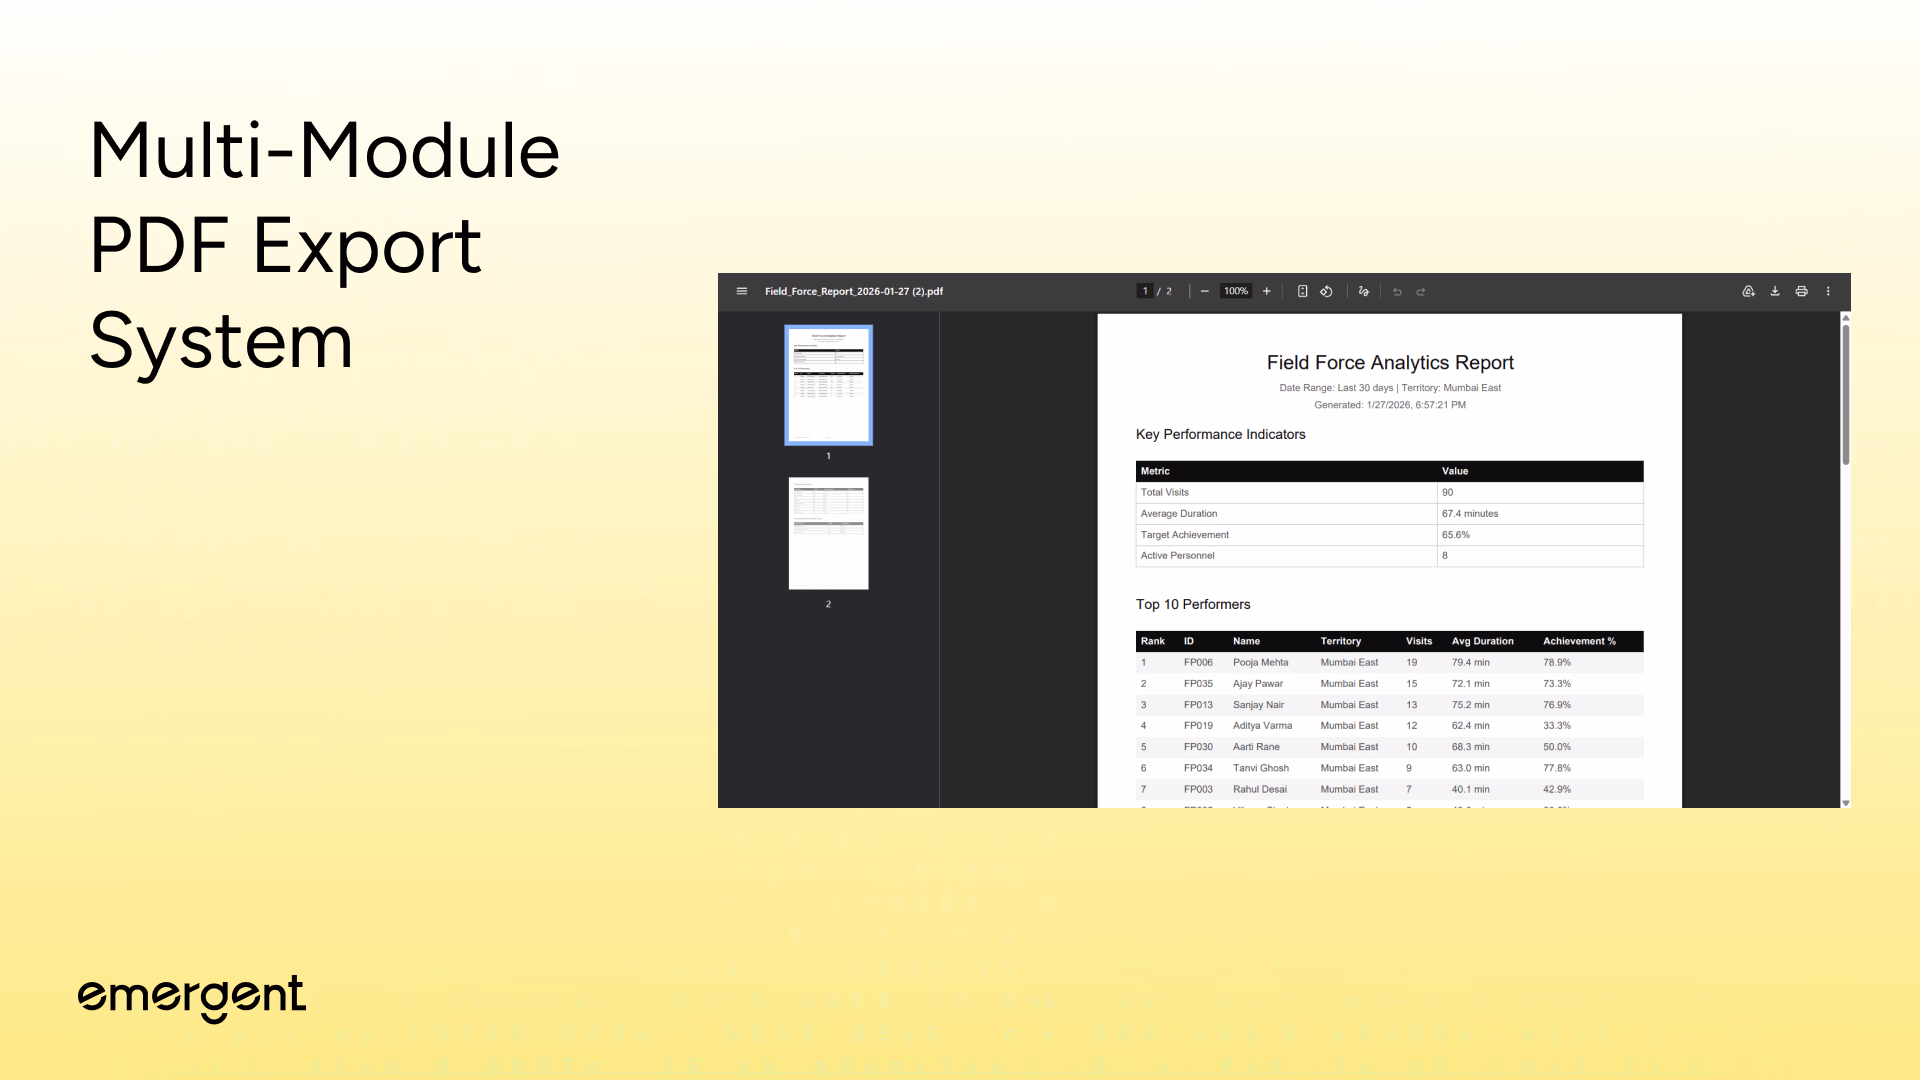
Step 5: Multi-Module PDF Export System
Managers generate professional reports for boardroom presentations and executive reviews, exporting comprehensive analytics with:
- Dashboard Analytics Reports - Complete performance overview with KPI summary, top 10 performers table, territory breakdown, and counter type distribution
- Personnel Performance Reports - Individual agent deep-dives showing visit history, achievement metrics, duration analysis, and target completion rates
- Competitor Intelligence Reports - Competitive landscape analysis with mentions table, win/loss breakdown, market share trends, and price comparison history
- Visit Schedule Reports - Upcoming appointments organized by date with personnel assignments, territories, counter types, and visit notes
- Client-Side Generation - jsPDF with autoTable plugin converts React data into printable documents without server-side rendering or external services
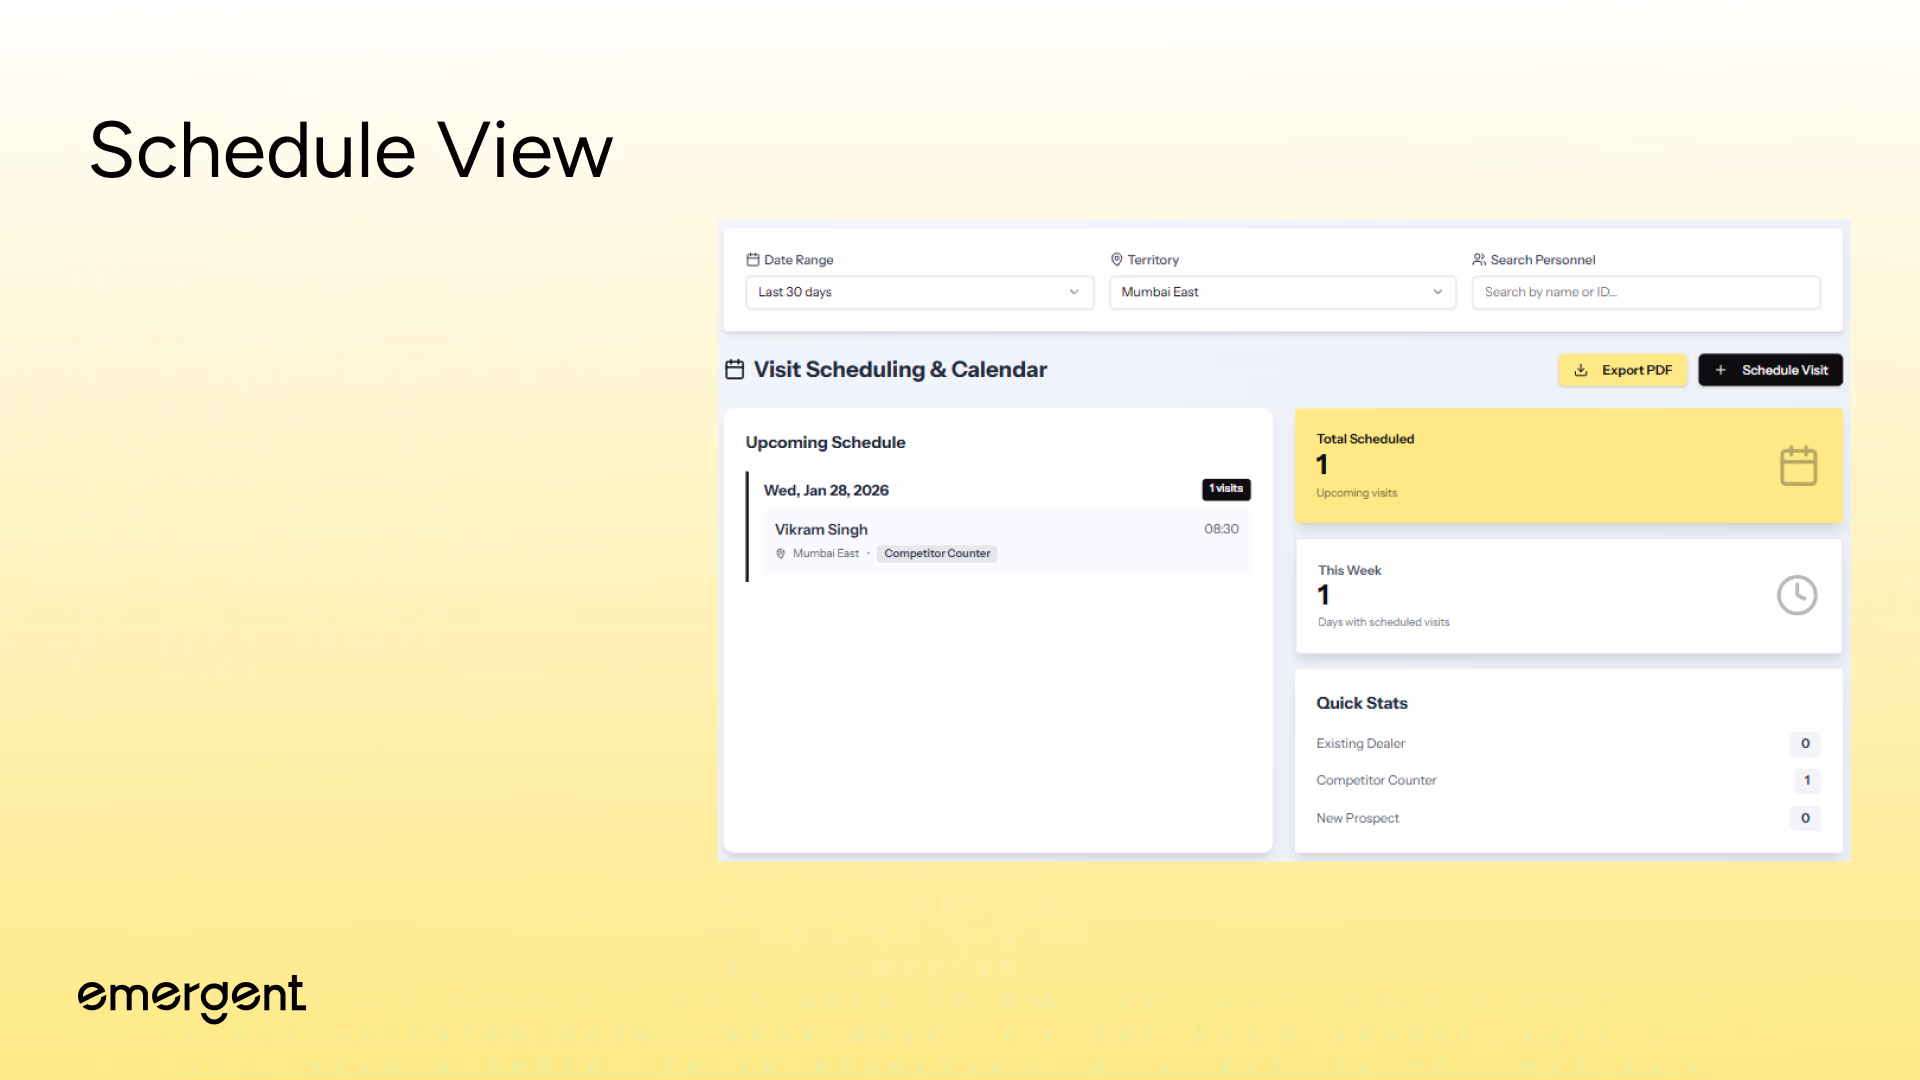
Step 6: Schedule View
Making Power Features Discoverable
Organizing Future Visits
A scheduling interface was added for planning field visits ahead of time.
Features include:
- Date-organized upcoming schedule (visits grouped by scheduled date with collapsible sections)
- Quick statistics cards (total scheduled count, this week's visits, counter type breakdown)
- Email notifications (automatic alerts via Resend API when visits are scheduled)
- Personnel and territory assignment (dropdown selectors with full agent roster and location data)
- PDF export capability (one-click report generation for printing and distribution)
- localStorage persistence (scheduled visits survive page reloads without backend database)
Real-time backend synchronization was intentionally excluded to keep the demo fully client-side and infrastructure-free.
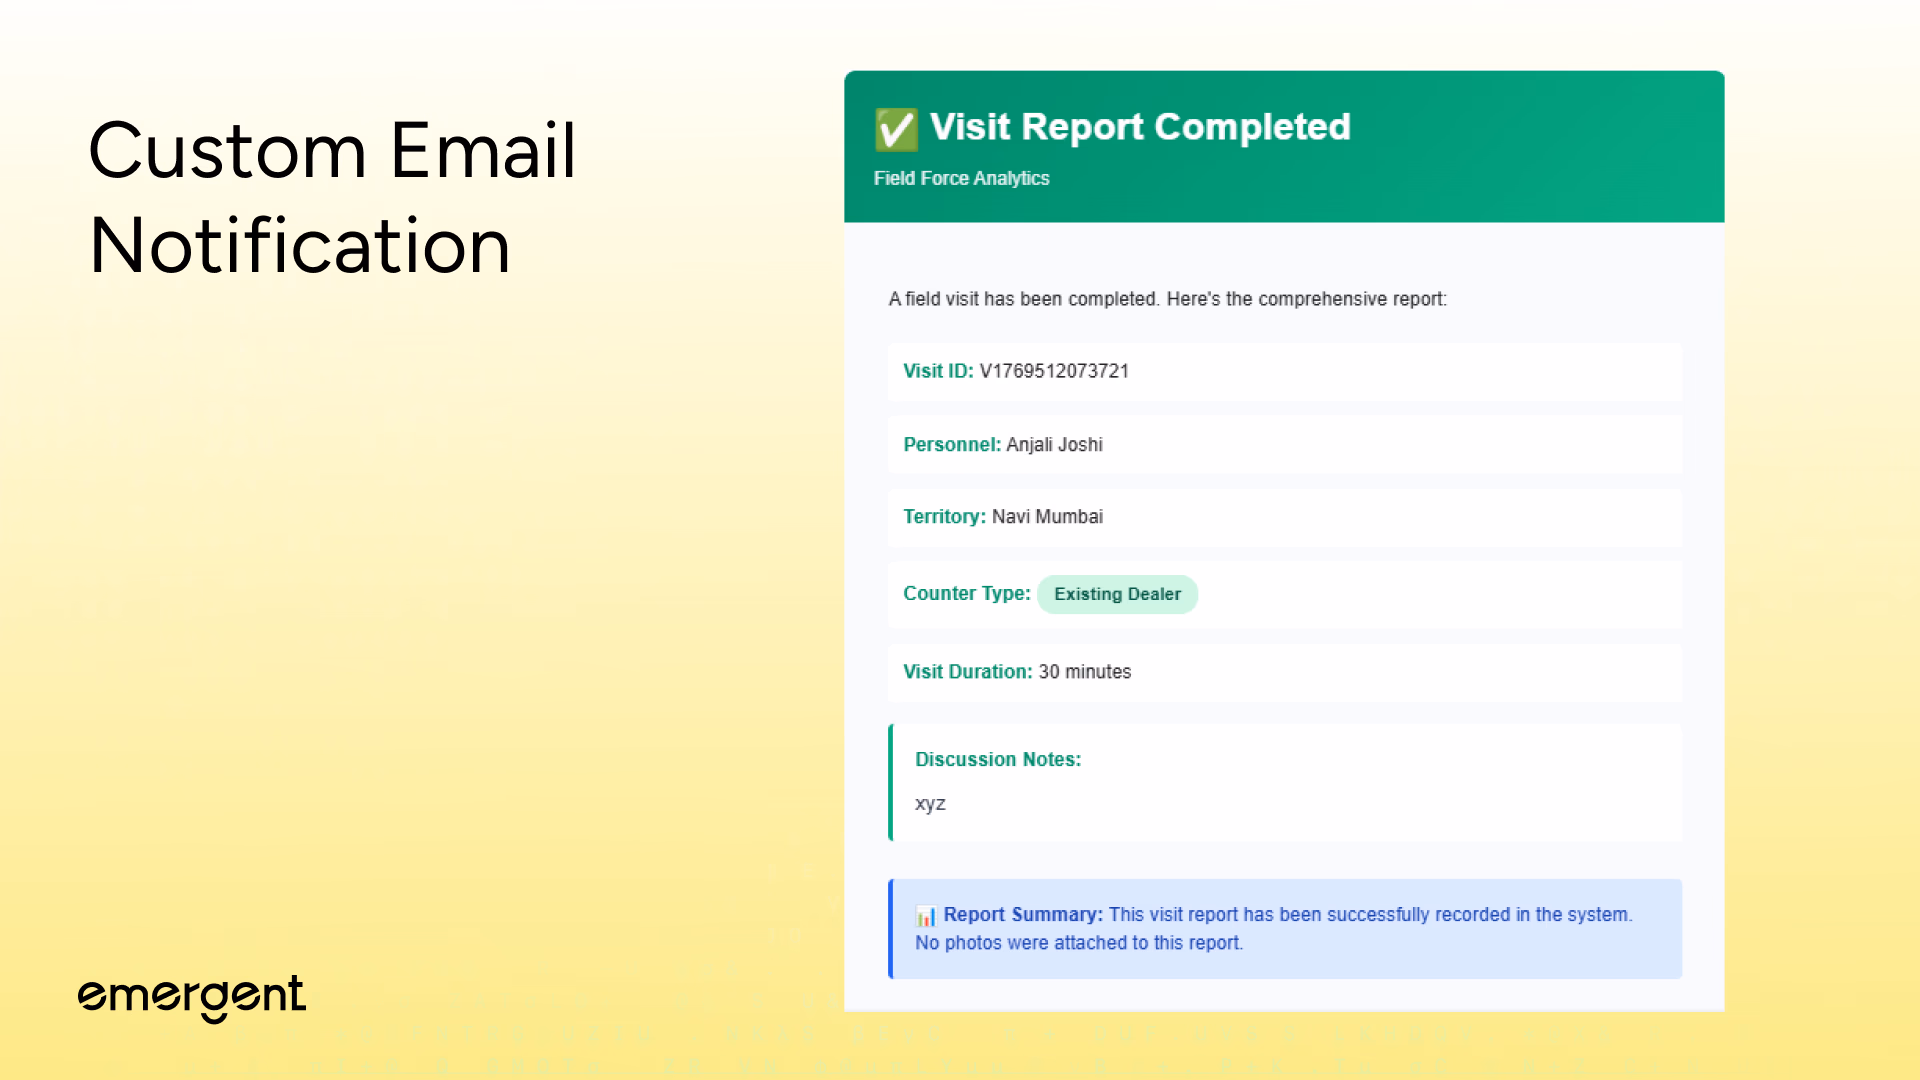
Step 7: Custom Email Notifications
Automated email notifications for completed visit reports using custom HTML templates with:
- Professional HTML Formatting - Gradient header with visit completion checkmark and company branding
- Complete Visit Metadata - Personnel name, territory, counter type, duration, and discussion excerpt display
- Embedded Photo Thumbnails - Up to 4 photos displayed inline with grid layout, remaining count shown if exceeding 4
- Color-Coded Status Badges - Visual indicators for counter type and visit completion with consistent color schemes
- Direct Photo Embedding - Supabase storage URLs render thumbnails in email HTML without attachment downloads
Troubleshooting and Key Hurdles
Several real-world issues surfaced during development:
- Chart Performance Lag - Fixed by aggressive useMemo optimization for 500+ data points
- localStorage Quota Exceeded - Fixed by removing duplicate visit storage and data deduplication
- AI Insights Timeout - Fixed by 60-second fetch timeout with graceful fallback responses
- PDF Export Crashes - Fixed by handling undefined data with defensive null checks
- State Synchronization Bugs - Fixed by callback-based localStorage updates instead of direct mutations
- Component Re-render Storms - Fixed by extracting monolithic logic into custom React hooks
Each issue reinforced the importance of performance profiling and defensive programming when handling large datasets client-side.
Deployment
Deployment involved:
- Building the React frontend
- Running FastAPI with environment variables
- Verifying OAuth redirect URLs
- Connecting MongoDB
- Testing bookings, emails, and integrations end-to-end
A final code health check removed console logs, validated APIs, and confirmed integration stability.
Here's a tutorial on deployment in particular.
Recap
You built a field force analytics platform that:
- Persists data locally without databases
- Extracts competitive intelligence from unstructured text
- Generates AI-powered strategic insights
- Visualizes 550+ GPS routes interactively
- Exports professional PDF reports for all modules
- Processes real-time analytics across multiple dimensions
Key Learnings
- Field force analytics is deceptively complex.
- localStorage can replace databases for stateful demos.
- Competitive intelligence must be extracted, not manually tagged.
- AI integrations should enhance insights, not block workflows.
- Chart performance and data aggregation matter as much as features.
Extension Ideas
Future improvements could include:
- Real-time GPS tracking
- Predictive visit recommendations via ML
- Mobile app for offline field agent submission
- Automated route optimization algorithms
- CRM integration for lead pipeline tracking
- Voice-to-text for hands-free report dictation
- Team performance gamification and leaderboards
- Automated competitor threat alerts
- Advanced forecasting dashboards
- Integration with inventory and order management
Final Demo
You can access the link (and use it) here.
If you’ve tried it out, share feedback or reach out and we’ll give you access to more behind-the-scenes builds and experiments.

Emergent turns your idea into a full-stack web or mobile app, no coding required.
 No coding required
- Web & mobile apps
- Deploys instantly


on Emergent today