Build a Custom Threat Intelligence Dashboard Using AI in Minutes
Describe your Threat Intelligence Dashboard in plain English and create a production-ready build, from design and development to deployment, in minutes. No code needed.


Trusted by Builders Worldwide
Active Builders Worldwide
Apps Successfully Created
Countries Globally Reached



Build a custom threat intelligence dashboard in 4 simple steps
See threats relevant to you rather than a feed of everything reported globally.
Describe your assets and sector, so relevance is judged against what you actually run.
Your feeds and asset inventory connect, so indicators are matched to systems you operate.
Tell it to add a new feed, a different relevance rule or results by threat actor.
Open one view where threats affecting your estate surface, rather than a general intelligence stream.
Emergent Key Features for Building a Threat Intelligence Dashboard
External intelligence correlated against your own assets and detection coverage rather than delivered as a feed.
Filtered to Your Estate
Intelligence is matched against the technology and sector you actually operate in, which removes the volume that makes feeds unreadable.
Indicators Matched to Logs
Published indicators are compared with your own detection data, turning intelligence into either a confirmed match or a coverage gap.
Detection Coverage Gaps
Indicators with no corresponding detection capability are identified, showing where intelligence exists but you would not notice the activity.
External Surface Discovery
Internet facing assets are compared against your inventory, revealing exposure nobody recorded, which is a common route in.
Exploitation Weighted Priority
Vulnerabilities under active exploitation on critical assets are ranked first, focusing limited remediation on realistic risk.
Leadership Context
Sector level threat activity is summarised in business terms, so security investment conversations reference the actual threat landscape.
Threat Intelligence Dashboard Use Cases You Can Build in Minutes
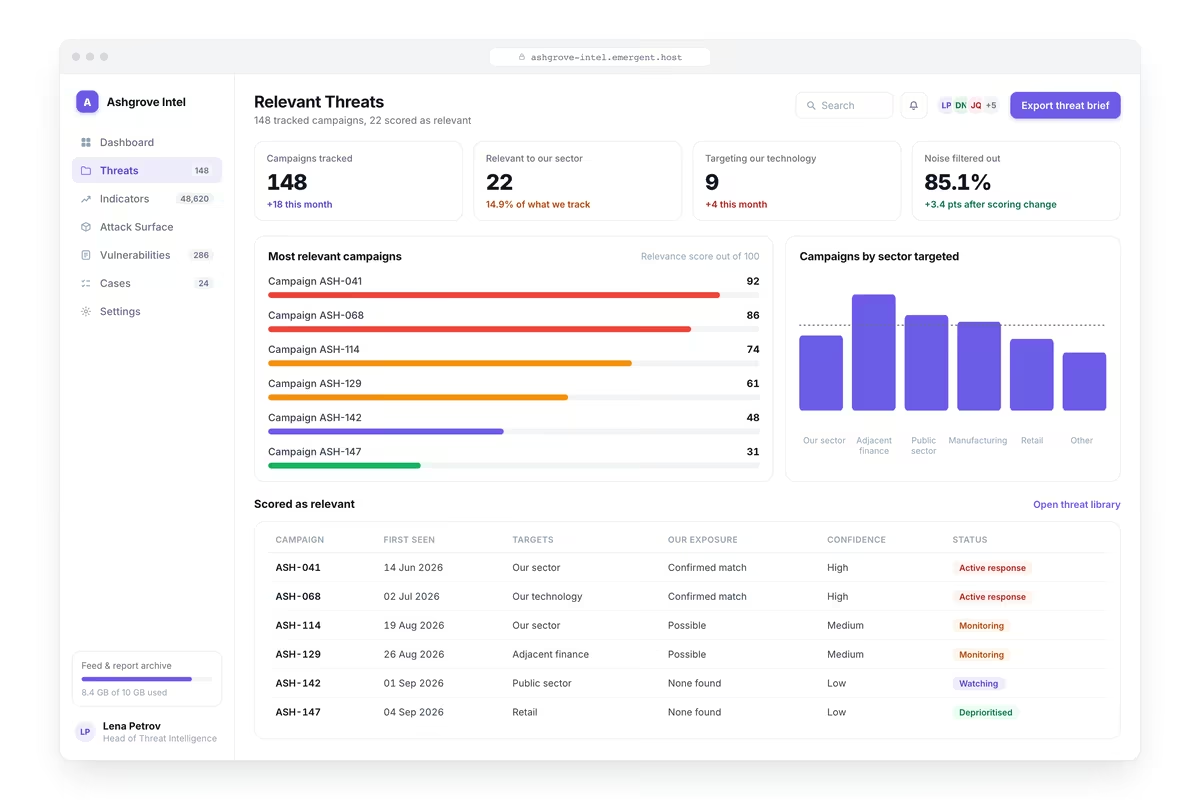
Filter the Feed Down to What Applies to You
Incoming intelligence matched to your own technology stack and sector, active campaigns targeting your industry, techniques reported in use, actors historically targeting similar organisations and items requiring an assigned action.
window.awbMockup = { relevantThreat: "Build a threat intelligence dashboard filtering incoming intelligence to your own technology stack and sector, showing active campaigns targeting your industry, techniques reported in use, threat actors historically targeting similar organisations, and intelligence items requiring an action with owner assigned.", indicatorMatching: "Build an indicator dashboard comparing published indicators of compromise against your own detection and network logs, showing matches found with affected assets, indicators newly added and their coverage status in your tooling, indicators with no detection capability, and the age of your indicator feeds.", attackSurface: "Build an external exposure dashboard listing internet facing assets discovered including domains, subdomains, open services and certificates, assets not present in your inventory, services exposed that should not be, certificates expiring, and exposed assets carrying known exploitable vulnerabilities.", exploitedVulnerability: "Build a vulnerability intelligence dashboard cross referencing published vulnerabilities under active exploitation against your own asset inventory, showing affected assets by criticality, patch availability and status, exposure duration since exploitation was reported, and remediation priority ranked by exploitability and asset importance."};

Turn Indicators into a Match or a Blind Spot
Published indicators of compromise compared against your own detection and network logs, matches found with affected assets, indicators newly added and their coverage in your tooling, and indicators with no detection capability.
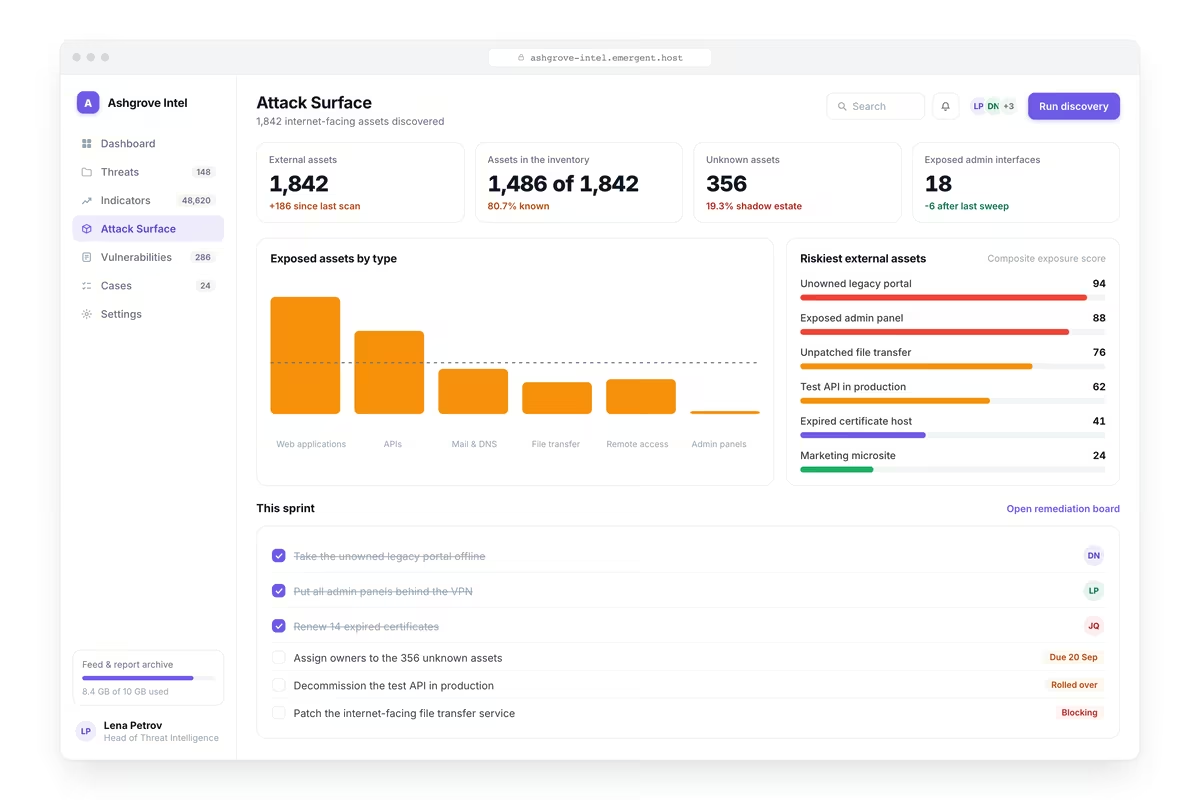
See What You Are Exposing to the Internet
Internet facing assets discovered including domains, subdomains, open services and certificates, assets absent from your inventory, services exposed that should not be, expiring certificates and exposed assets with exploitable vulnerabilities.

Patch What Is Being Exploited Right Now
Published vulnerabilities under active exploitation cross referenced against your asset inventory, affected assets by criticality, patch availability and status, exposure duration since exploitation was reported and remediation priority.
Every integration your
Dashboard needs from day one
Email and calendar
Inbox and calendar sync both ways, so every reply, meeting and no-show lands on the contact record without anyone logging it.




Messaging and support
Conversations from chat, WhatsApp and your helpdesk attach to the right contact, so sales and support see the same history.




Payments and billing
Invoices, subscriptions and payment status flow back into the deal, so revenue and pipeline stay in one place.




If it has an API, your CRM can connect to it.
Emergent builds the connection against the API itself, including internal tools your team made. No closed ecosystem, no approved-partner list, no waiting for a connector to ship.

More things you can build
with Emergent
AI Website Builder
Build and publish responsive websites with AI — from landing pages to complete websites.
AI App Builder
Create and launch mobile apps with AI, without the complexity of traditional app development.
AI Web App Builder
Build and ship fully functional web apps with custom interfaces, logic, and workflows.
AI Dashboard Builder
Create interactive dashboards to visualize data, track KPIs, and manage business operations.
AI SaaS Builder
Build complete SaaS products with user accounts, subscriptions, dashboards, and core product workflows.
AI CRM Builder
Build custom CRMs for managing contacts, leads, pipelines, campaigns, and automated workflows.
AI Agent Builder
Create AI agents that can understand tasks, use tools, automate workflows, and work across your business.
Build Your Own
Start with any idea and build exactly what you need with AI — no templates or limits.

Why choose Emergent?
Most tools give you a demo you have to rebuild. Emergent gives you a product that is ready to run.
| Comparison | Other Tools |  |
|---|---|---|
| Built for | Demos and MVPs | Products you keep growing |
| What you get | Front end shell only | Full stack, wired end to end |
| Backend and database | Set it up yourself | Built and connected for you |
| Customization | Surface level styling | Deep workflow control |
| Integrations and APIs | Manual glue work | Connected from a prompt |
| Code ownership | Locked to the platform | Clean code you can export |
| Time to launch | Weeks of patching and setup | Live the same day |
Pick the Pricing Plan That Works for You
Choose the plan that fits your building ambitions. From weekend projects to enterprise applications, we've got you covered.




Find the Right Dashboard Builder
for Your Business
Frequently Asked Questions
Your Questions, Answered
Don't change this element unless you know what you are doing
on Emergent today