TL;DR
- Emergent: Best dashboard builder when the dashboard needs to become a custom app with forms, user roles, workflows, and business logic.
- Zoho Analytics: Best overall dashboard builder for small and midsize businesses that need affordable business intelligence, AI help, and broad data connections.
- Microsoft Power BI: Best dashboard builder for teams already using Excel, Microsoft 365, Azure, Fabric, and Teams.
- Zite: Best for non-technical teams that want custom dashboards over their own data with spreadsheet-like editing and inspectable app logic.
Most dashboard tools look useful until your team tries to turn them into a real decision system. Sales wants pipeline movement, marketing wants campaign return on investment, leadership wants weekly revenue, and operations wants blockers before they become problems.
I compared the leading options against four distinct business needs: cross-team reporting, Microsoft-native analytics, custom app workflows, and visibility into the underlying data and logic. Zoho Analytics, Power BI, Emergent, and Zite gave the clearest answer for each.
This guide focuses on the top four instead of giving every decent dashboard tool equal space. The other strong options appear under “Other Tools Worth Checking Out,” with their pricing, strengths, and the reason each missed the main list.
Dashboard Builder Vs BI Dashboard Tool Vs Custom Dashboard Software
A dashboard builder helps you turn data into visual reports. You connect a data source, choose charts, arrange metrics, add filters, and share the finished dashboard.
A business intelligence (BI) dashboard tool gives you deeper analysis. BI tools help you connect multiple sources, clean data, control permissions, explore trends, and build dashboards for different teams. Zoho Analytics and Power BI fit this job best.
Custom dashboard software works better when your dashboard needs to do something, not only show something. If you need logins, role-based access, form submissions, approval flows, client portals, database edits, or automated follow-ups, Emergent is the stronger fit because it builds a working app around the dashboard.
Zite sits between familiar spreadsheet work and a custom business app. You can build a dashboard over Zite Database, Google Sheets, Airtable, Salesforce, or other business data, then inspect the records, workflow diagram, TypeScript logic, and execution history without needing to write the code yourself.
If you're torn between Emergent's approach and the visual builders, the vibe coding vs no-code comparison lays out the tradeoff properly.
How I Compared These Dashboard Builder Tools
I compared every tool against the same dashboard brief: a sales pipeline view with filters, role-based access, editable records, and an overdue-deal alert. I checked which products support those requirements, how their free and entry plans limit the setup, and where each tool stops being the right fit.
I ranked the tools by five practical criteria:
- Dashboard depth: Can you build useful reports, charts, filters, and team-specific views?
- Data connections: Can you connect spreadsheets, apps, databases, warehouses, and custom sources?
- AI support: Does AI help create reports, explain data, generate dashboards, or build the app around the dashboard?
- Workflow fit: Can the dashboard support approvals, forms, roles, actions, or business logic?
- Pricing clarity: Can you understand the free plan, starter paid plan, annual pricing, and enterprise path?
I cut the main list to four because most buyers need one of four things: a BI dashboard platform, a Microsoft-native dashboard platform, a custom dashboard app, or a controlled business dashboard where non-technical teams can inspect both the underlying data and the logic acting on it.
4 Best Dashboard Builder Tools: Quick Comparison
| Tool | Best For | Free Plan | Starter Paid Price |
|---|---|---|---|
| Emergent | Custom dashboard apps | Yes | $20/month ($17/month billed annually) |
| Zoho Analytics | SMB BI dashboards | Yes | $30/month ($24/month billed annually) |
| Microsoft Power BI | Microsoft-first analytics | Yes | $14/user/month, paid yearly |
| Zite | Dashboards with visible data and logic | Yes | $19/month ($15/month billed annually) |
1. Emergent: Best For Custom Dashboard Apps
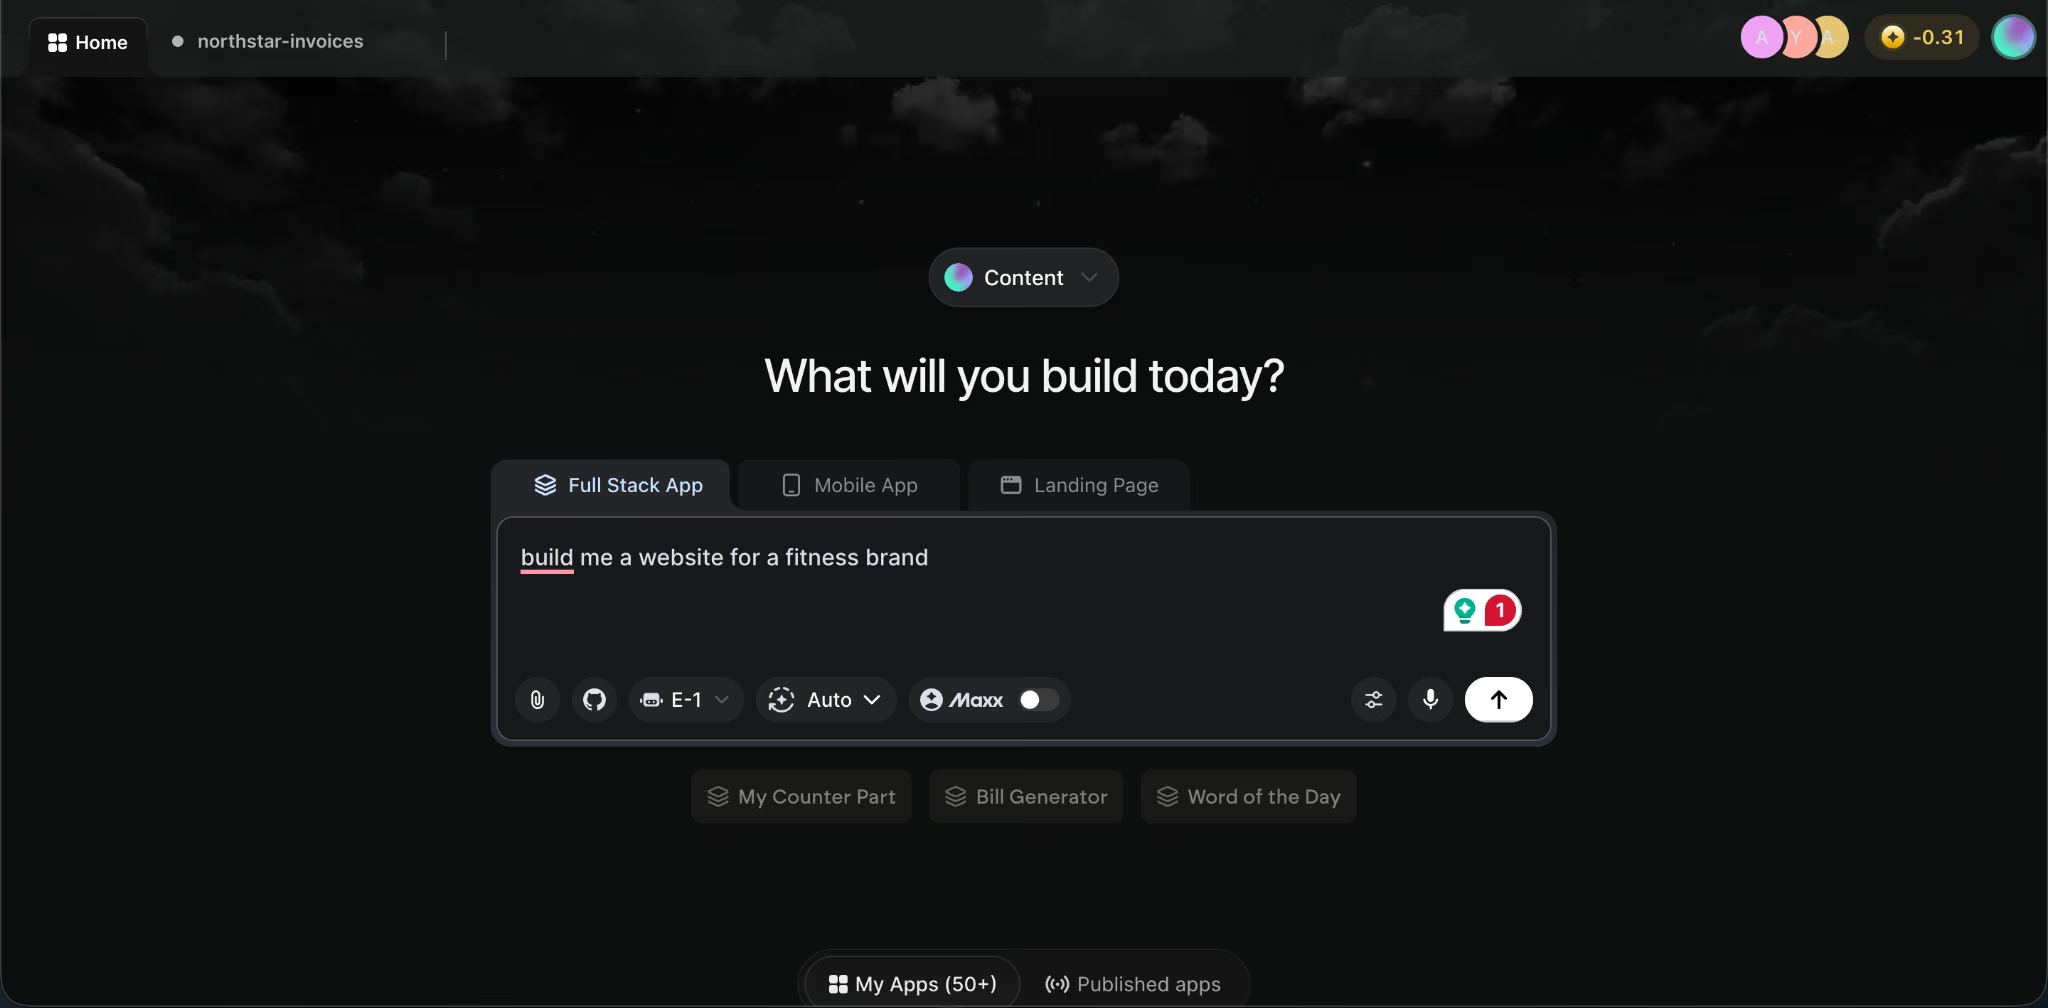
What it does: Emergent lets you describe an app in plain language, then AI agents help design, code, deploy, and refine the application.
Best for: Founders, consultants, agencies, operators, and service businesses building custom dashboard apps with workflows, roles, forms, and business logic.
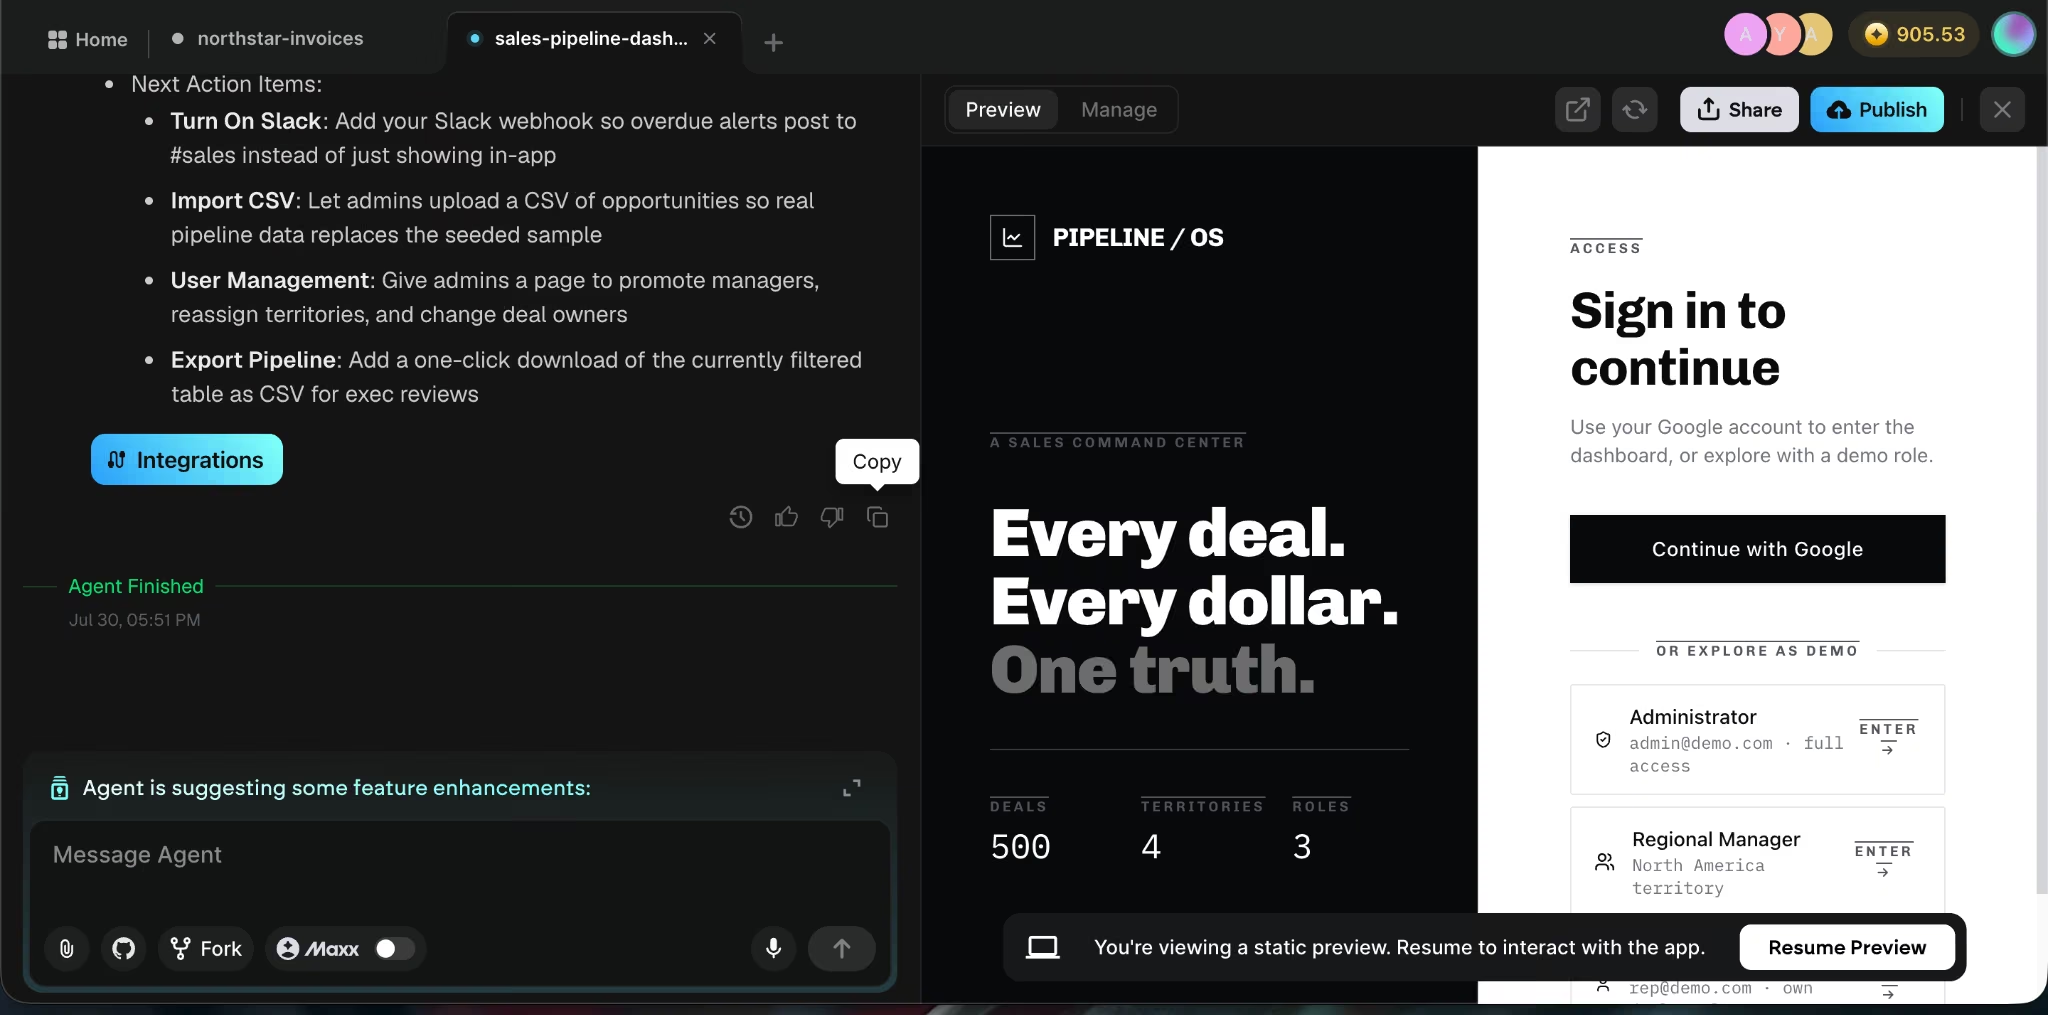
I built the same sales pipeline dashboard in Emergent using 500 opportunity records across four territories. The app included three role types, five KPI views, a stage funnel, a territory bar chart, a filterable editable table, an opportunity-edit dialog, and a dedicated overdue-deals page.
My exact prompt was:
“Build a responsive sales pipeline dashboard web app using the CSV file I uploaded. Add secure login for administrators, regional managers, and sales representatives; give each role access only to the records it should see; add editable opportunity records, territory and deal-stage filters, and a Slack alert when a deal becomes overdue.”
Emergent’s testing agent reported a 100% backend pass rate and a 100% frontend pass rate. The administrator could access all 500 records, the North America regional manager could access 156, and the test sales representative could access 61. Server-side role-based access control also worked correctly, returning a 403 response when a user tried to update an opportunity outside their assigned scope.
The dashboard’s role permissions, record editing, filters, and mobile navigation passed end-to-end testing. Slack was the one incomplete part of the original brief: I chose to skip the live webhook, so Emergent replaced the external message with an in-app toast that fires once per overdue deal using an overdue_notified flag.
My verdict: Emergent is the strongest choice when your dashboard needs to become a complete app with logins, editable records, role-specific views, workflows, and deployment. Skip it when you only need a few read-only charts from an existing spreadsheet.
Emergent deserves a top-four spot because many people searching for a dashboard builder need more than reports. They need a dashboard inside a working app.
Think about a consultant building a client reporting portal. The client logs in, uploads numbers, sees a private dashboard, approves recommendations, and gets a weekly summary. That’s a custom dashboard app, not a standard BI report.
Emergent fits that job because it builds web and mobile apps through conversation. Its platform can create dashboards, internal business applications, software-as-a-service tools, mobile apps, ecommerce sites, and more, with AI handling the coding, design, and deployment from your natural-language instructions.
The key difference is workflow depth. Zoho Analytics and Power BI help you understand data. Emergent helps you build the product around the data, including forms, permissions, app screens, user flows, and launch support.
That also creates the main caution. If the app touches payments, personal data, production databases, user roles, or customer accounts, treat the generated app as draft software until a qualified person reviews security, permissions, and logic.
If you'd rather stop comparing and start building, this guide on creating a business app takes you through it end to end.
Key Features
- Conversational app building: You describe what you want to build, and Emergent turns the idea into an app through a prompt-led workflow.
- Web and mobile app support: Emergent supports web apps and mobile apps, which matters when your dashboard needs to work outside a browser-only BI tool.
- Private hosting and GitHub integration: Standard includes private project hosting, 100 monthly credits, extra credit purchases, GitHub integration, and fork tasks.
- Custom AI agents on Pro: Pro adds a 1M context window, system prompt editing, custom AI agents, high-performance computing, 750 monthly credits, and priority support.
Pros And Cons
Pros:
- ✅ Best fit when the dashboard needs forms, roles, app screens, and workflows.
- ✅ Stronger than normal BI tools for custom client portals and internal tools.
- ✅ Free plan lets you explore the build workflow before paying.
Cons:
- ❌ Not the right pick for simple reporting from one spreadsheet.
- ❌ Credit-based pricing depends on how complex the app is and how much you refine it.
- ❌ Human review is still necessary for sensitive, regulated, payment-related, or production-critical apps.
Pricing
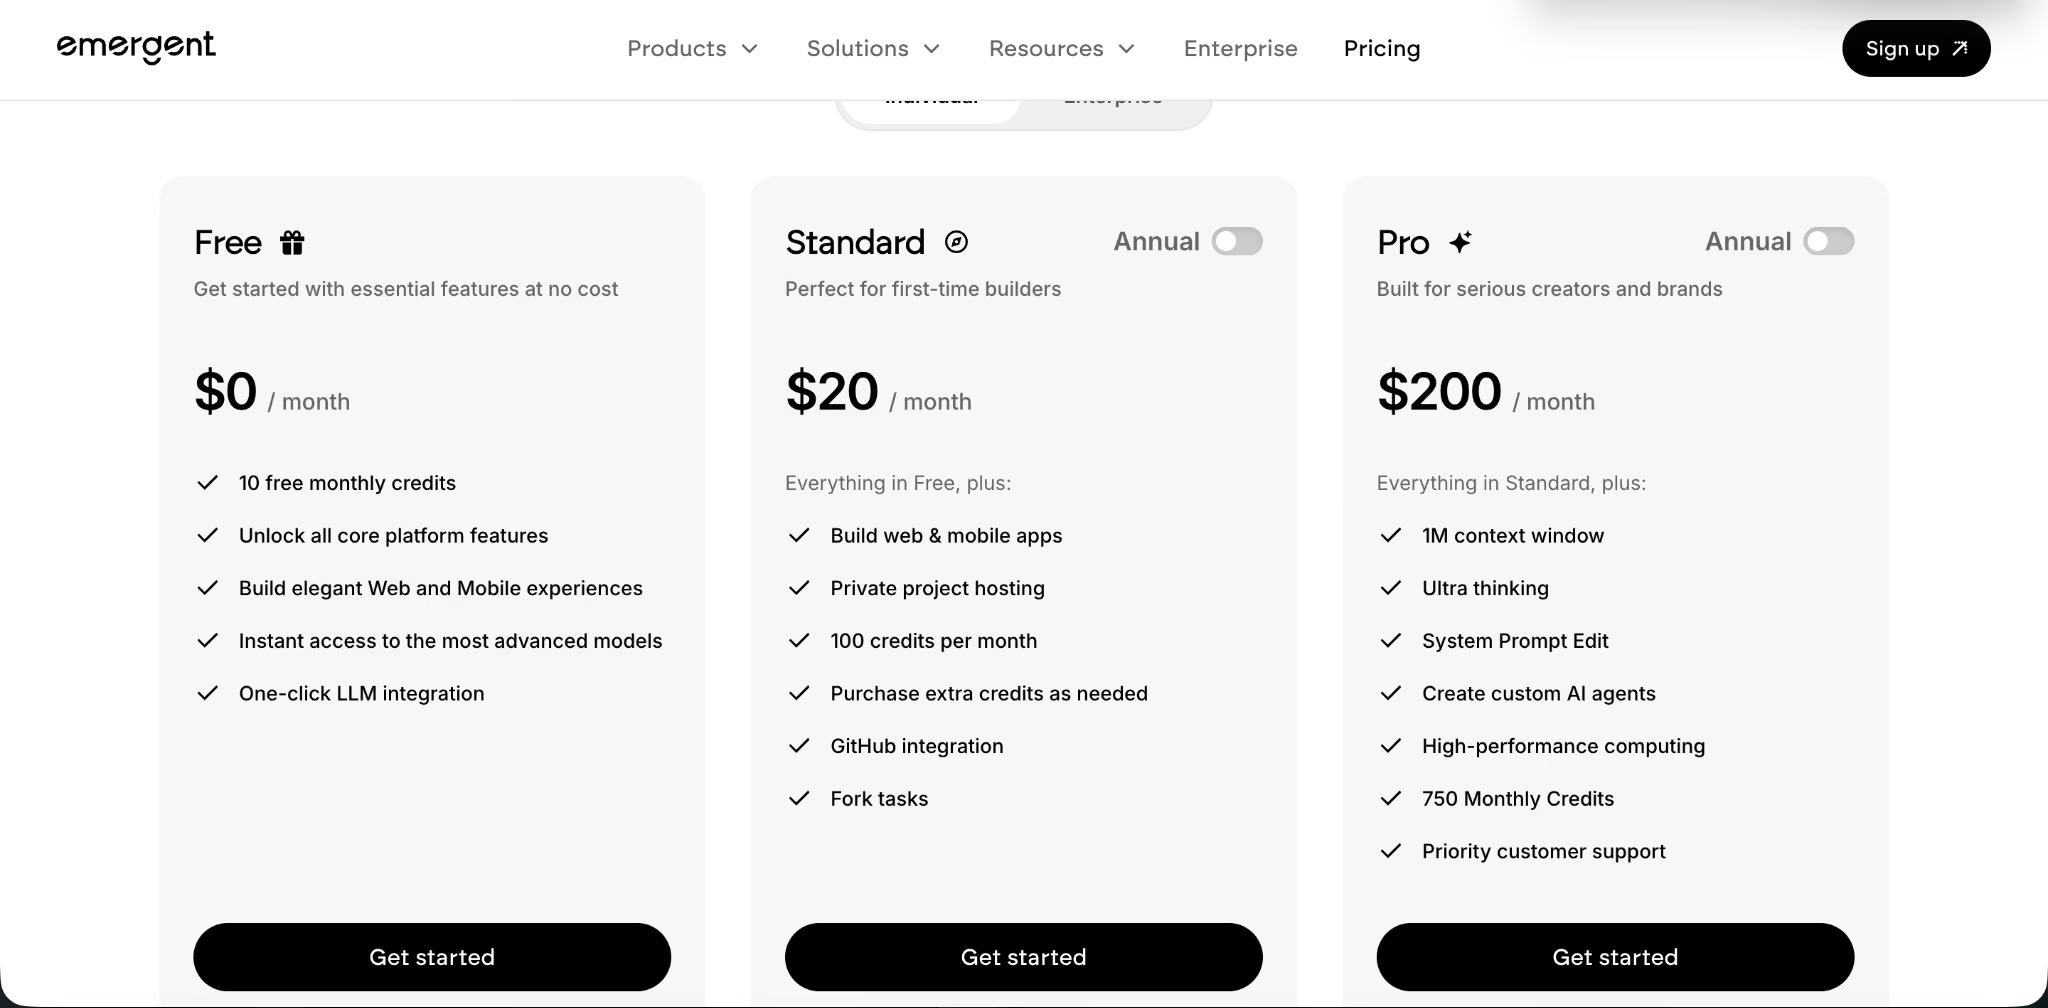
Emergent pricing starts with Free at $0/month with 10 free monthly credits, Standard at $20/month ($17/month billed annually) with 100 credits, Pro at $200/month ($167/month billed annually) with 750 monthly credits, and Enterprise with custom pricing. Standard adds web and mobile app building, private project hosting, GitHub integration, and fork tasks.
Bottom Line
Choose Emergent if your dashboard needs to become a real app with users, workflows, permissions, forms, and launch support. Choose Zoho Analytics or Power BI if you only need reporting and analysis.
2. Zoho Analytics: Best Overall Dashboard Builder
What it does: Zoho Analytics helps you connect data, prepare data, create reports, build dashboards, and analyze performance with AI support.
Best for: Small and midsize businesses that need dashboards across sales, marketing, finance, operations, and leadership reporting.
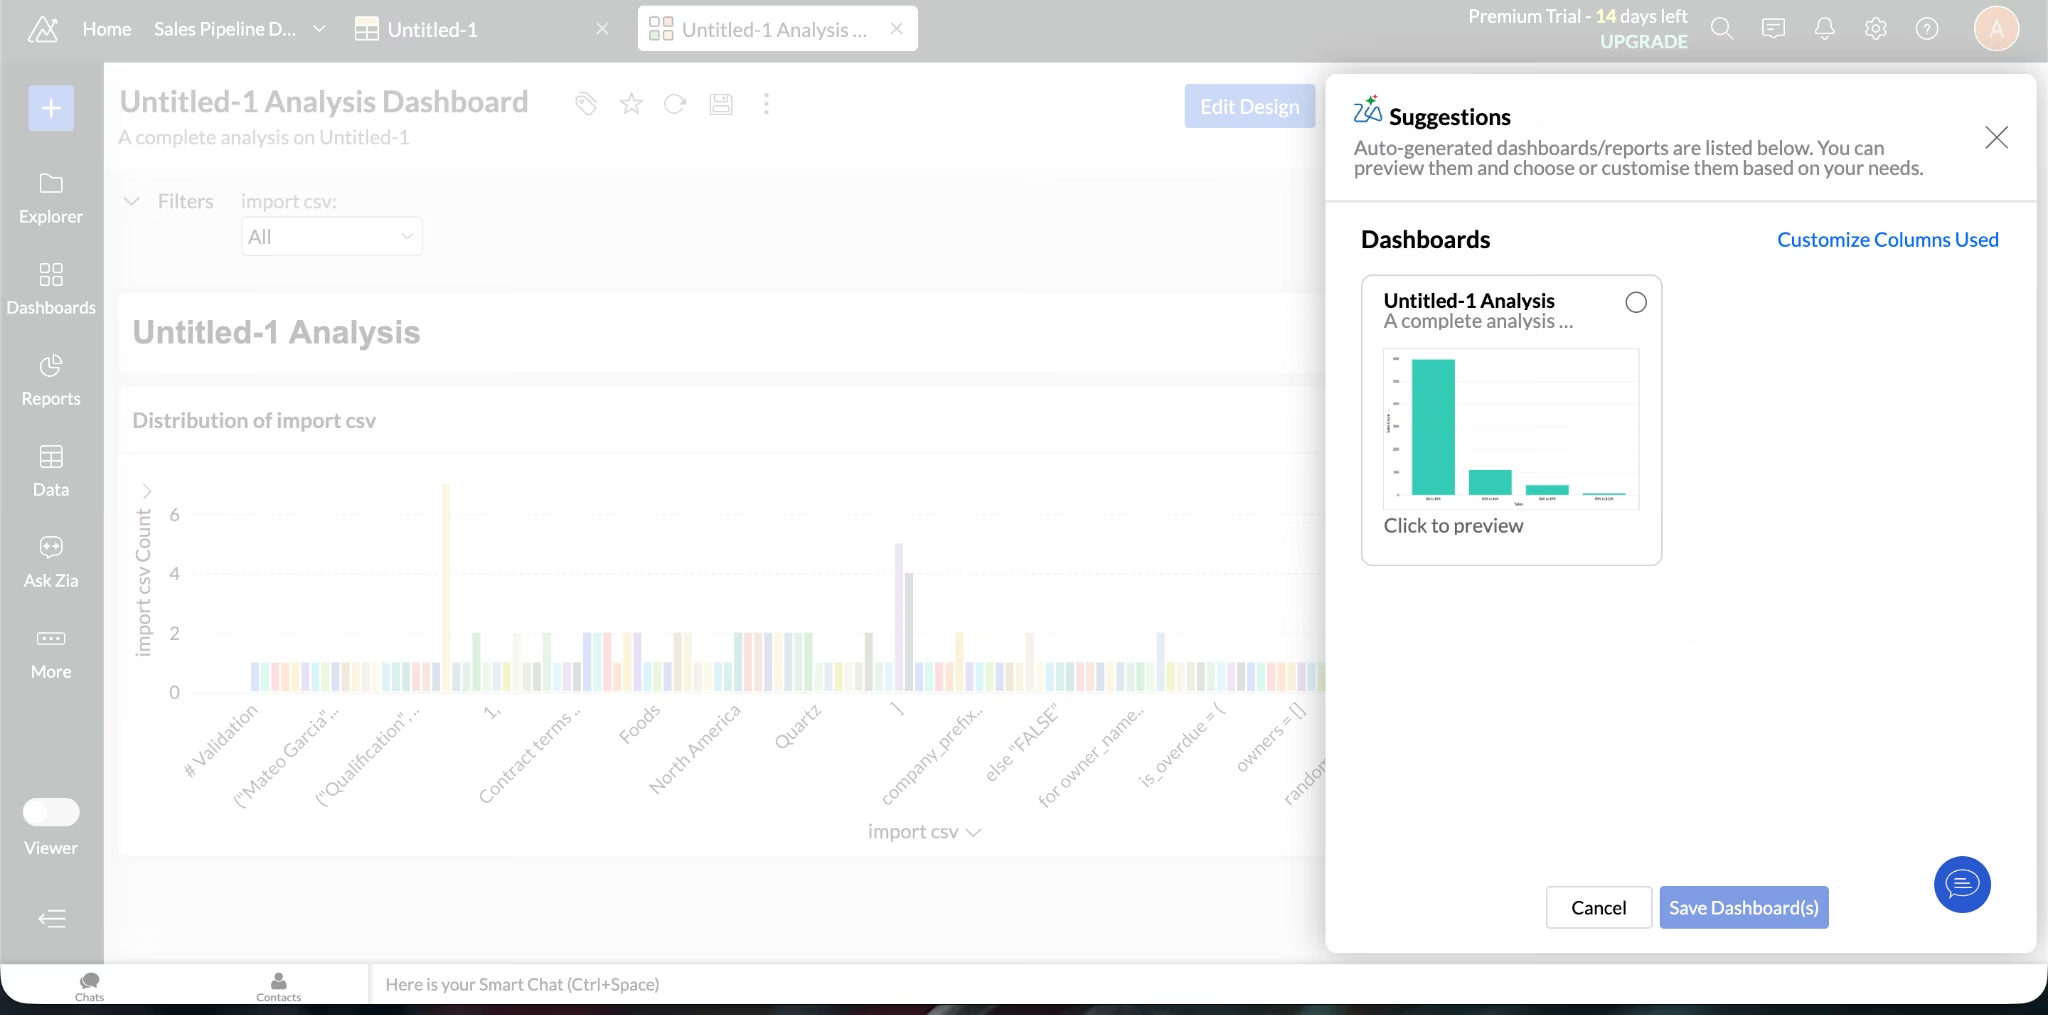
In a quick hands-on pass, Zoho turned an uploaded file into a suggested dashboard right away, the fast start it's known for. The catch is that it builds from whatever you give it: when my first upload was the wrong file type, Zoho charted the raw contents without flagging the problem. Inspect your imported table first, and that speedy on-ramp works in your favor.
Zoho Analytics takes the top spot because it covers the most dashboard-building needs without pushing you into enterprise pricing. You can connect business apps, files, feeds, databases, data lakes, warehouses, and 500+ data sources, then use 50+ visualizations to build dashboards with charts, filters, drilldowns, and widgets.
The biggest advantage is that Zoho works for both technical and non-technical teams.
A data analyst can build deeper reports with formulas, query tables, application programming interfaces (APIs), and data preparation tools. A business user can ask Zia questions in natural language and turn the answers into reports or KPI widgets.
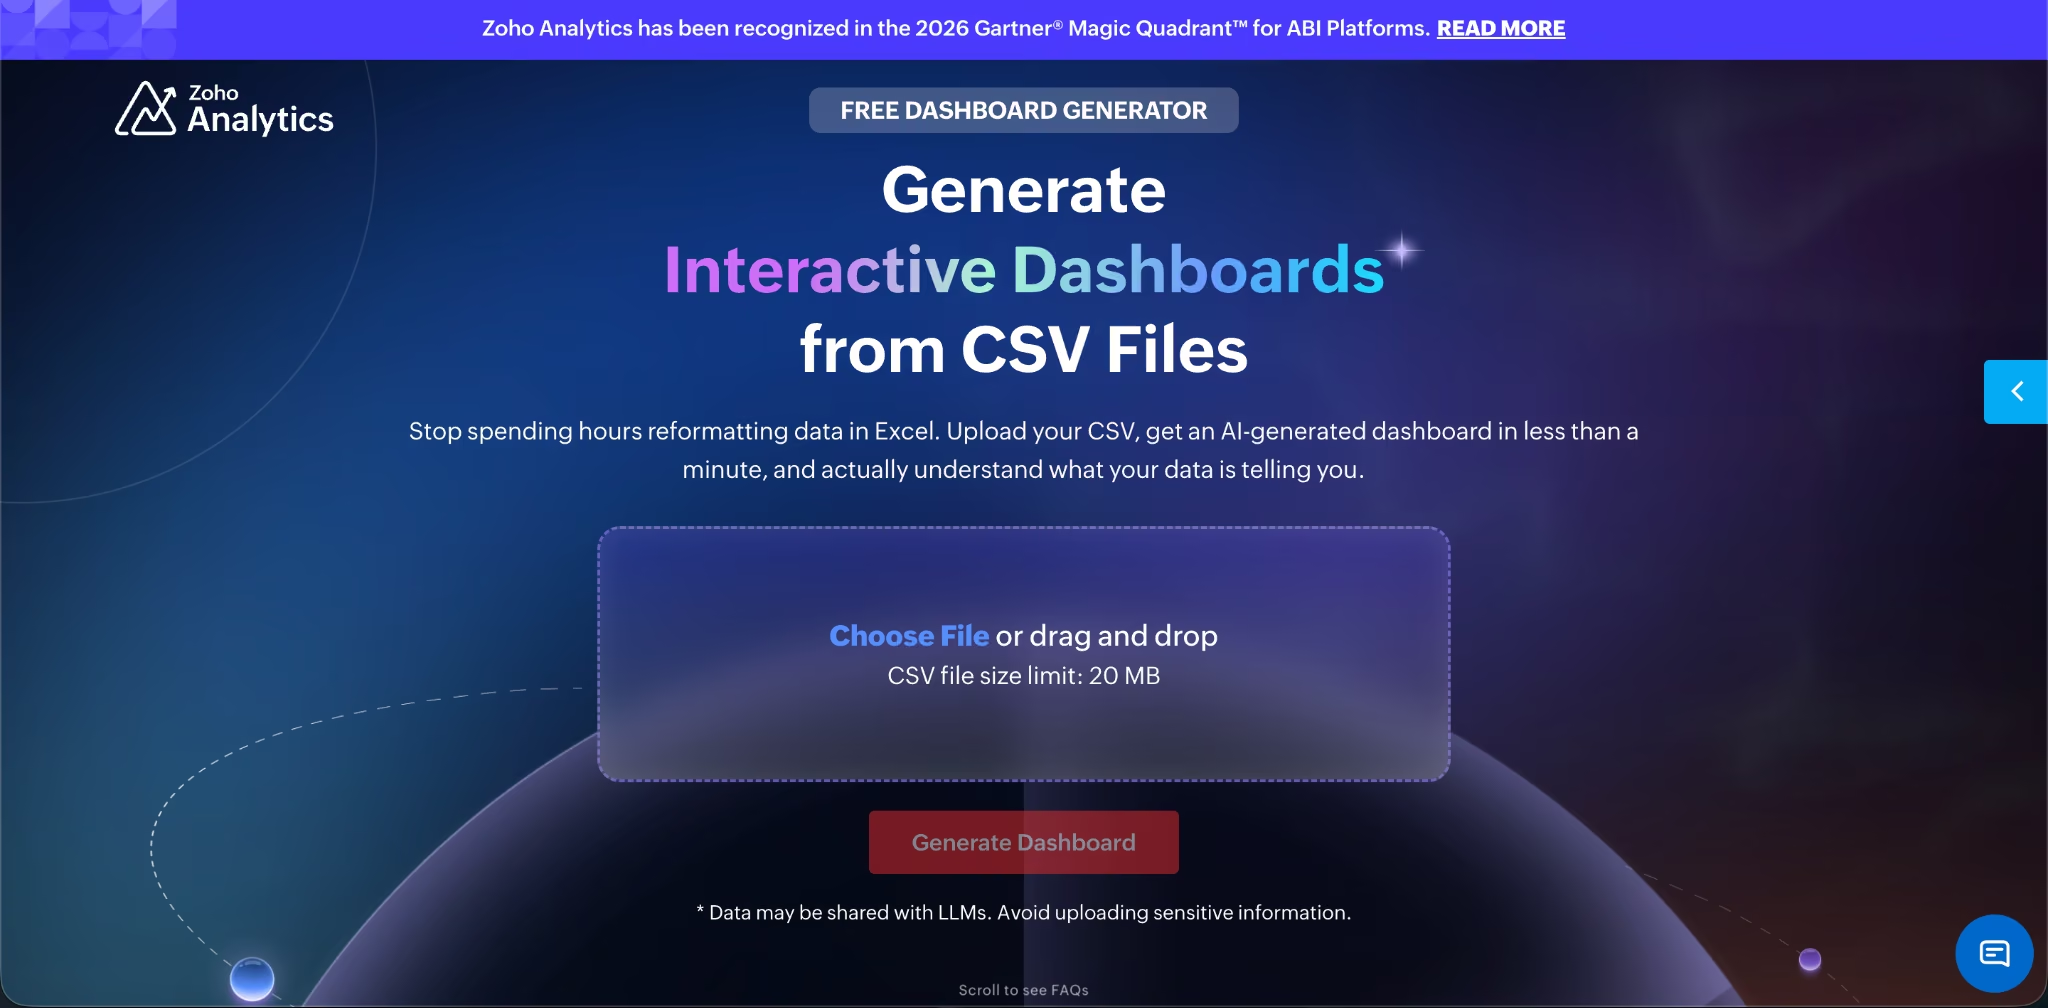
Zoho also has one of the more useful free dashboard entry points. Its free dashboard generator lets you upload a comma-separated values (CSV) file up to 20 MB and generate an interactive dashboard, while the full Zoho Analytics product adds automatic updates, collaboration, sharing, AI-generated insights, and more serious data control.
Key Features
- 500+ data connections: Zoho connects to business apps, databases, warehouses, files, feeds, and custom sources, which helps when your data is spread across departments.
- Ask Zia AI agent: You can ask questions in natural language and get reports, widgets, automated insights, and recommended next steps.
- 50+ visualizations: Zoho supports charts, dashboards, filters, drilldowns, brushing, tooltips, and other interactive dashboard controls.
- Sharing and governance: Teams can use permissions, row-level security, roles, groups, portals, scheduled emails, and collaboration options.
Pros And Cons
Pros:
- ✅ Best all-around balance of price, dashboard depth, AI, and data connections.
- ✅ Strong free plan for small teams and early dashboard experiments.
- ✅ Works across sales, marketing, finance, operations, ecommerce, human resources, and project reporting.
Cons:
- ❌ Advanced analytics still takes setup work.
- ❌ Large teams will need to watch user, row, refresh, and permission needs.
- ❌ The free AI dashboard generator is useful for quick CSV dashboards, but it’s not a full BI setup.
Pricing
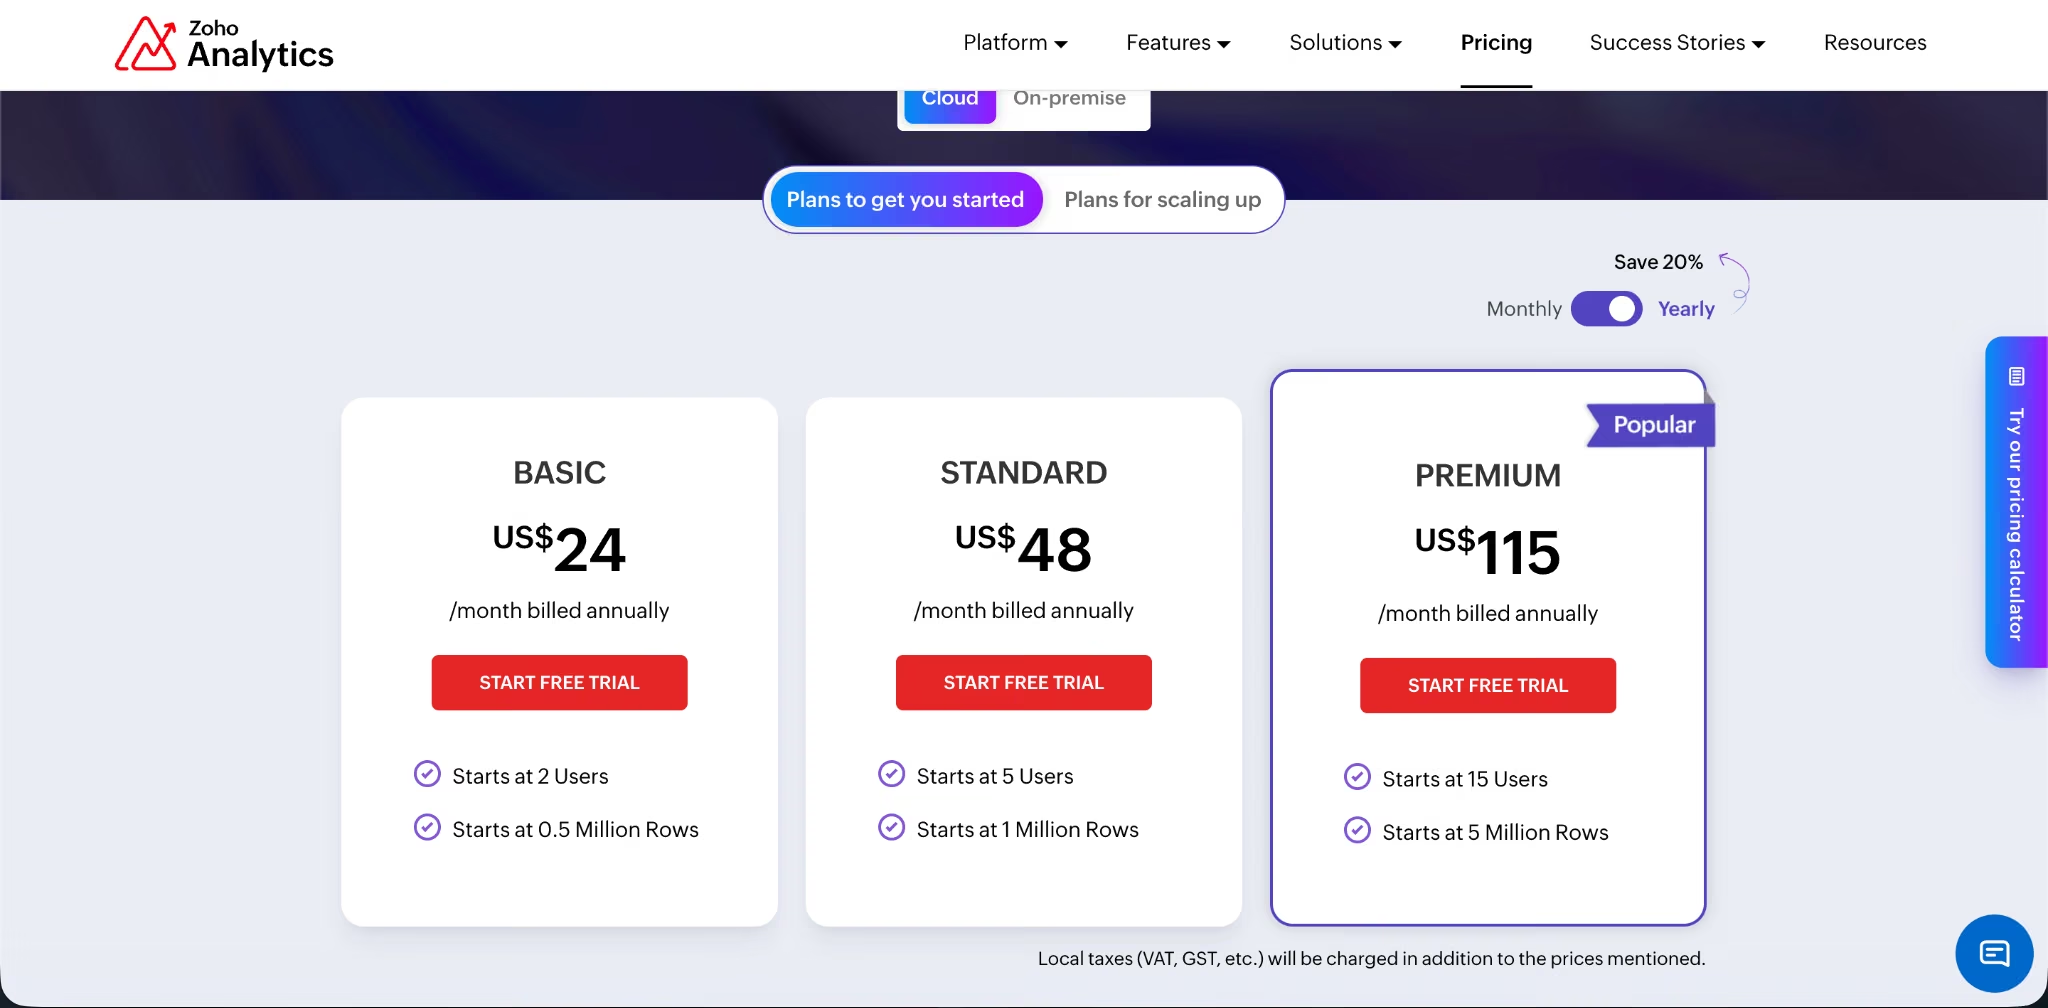
Zoho Analytics basic offer starts at $30/month ($24/month billed annually), Standard starts at $60/month ($48/month billed annually), Premium starts at $145/month ($115/month billed annually), Enterprise starts at $575/month ($455/month billed annually), and Dedicated Compute uses custom pricing.
The Free plan includes 2 users, 10,000 rows, 5 workspaces, and unlimited reports and dashboards. Zoho also offers a 15-day free trial with no credit card required.
Bottom Line
Choose Zoho Analytics if you want the best dashboard builder for normal business reporting. It gives you the strongest mix of affordability, AI assistance, dashboard depth, and data-source coverage.
3. Microsoft Power BI: Best For Microsoft-First Teams
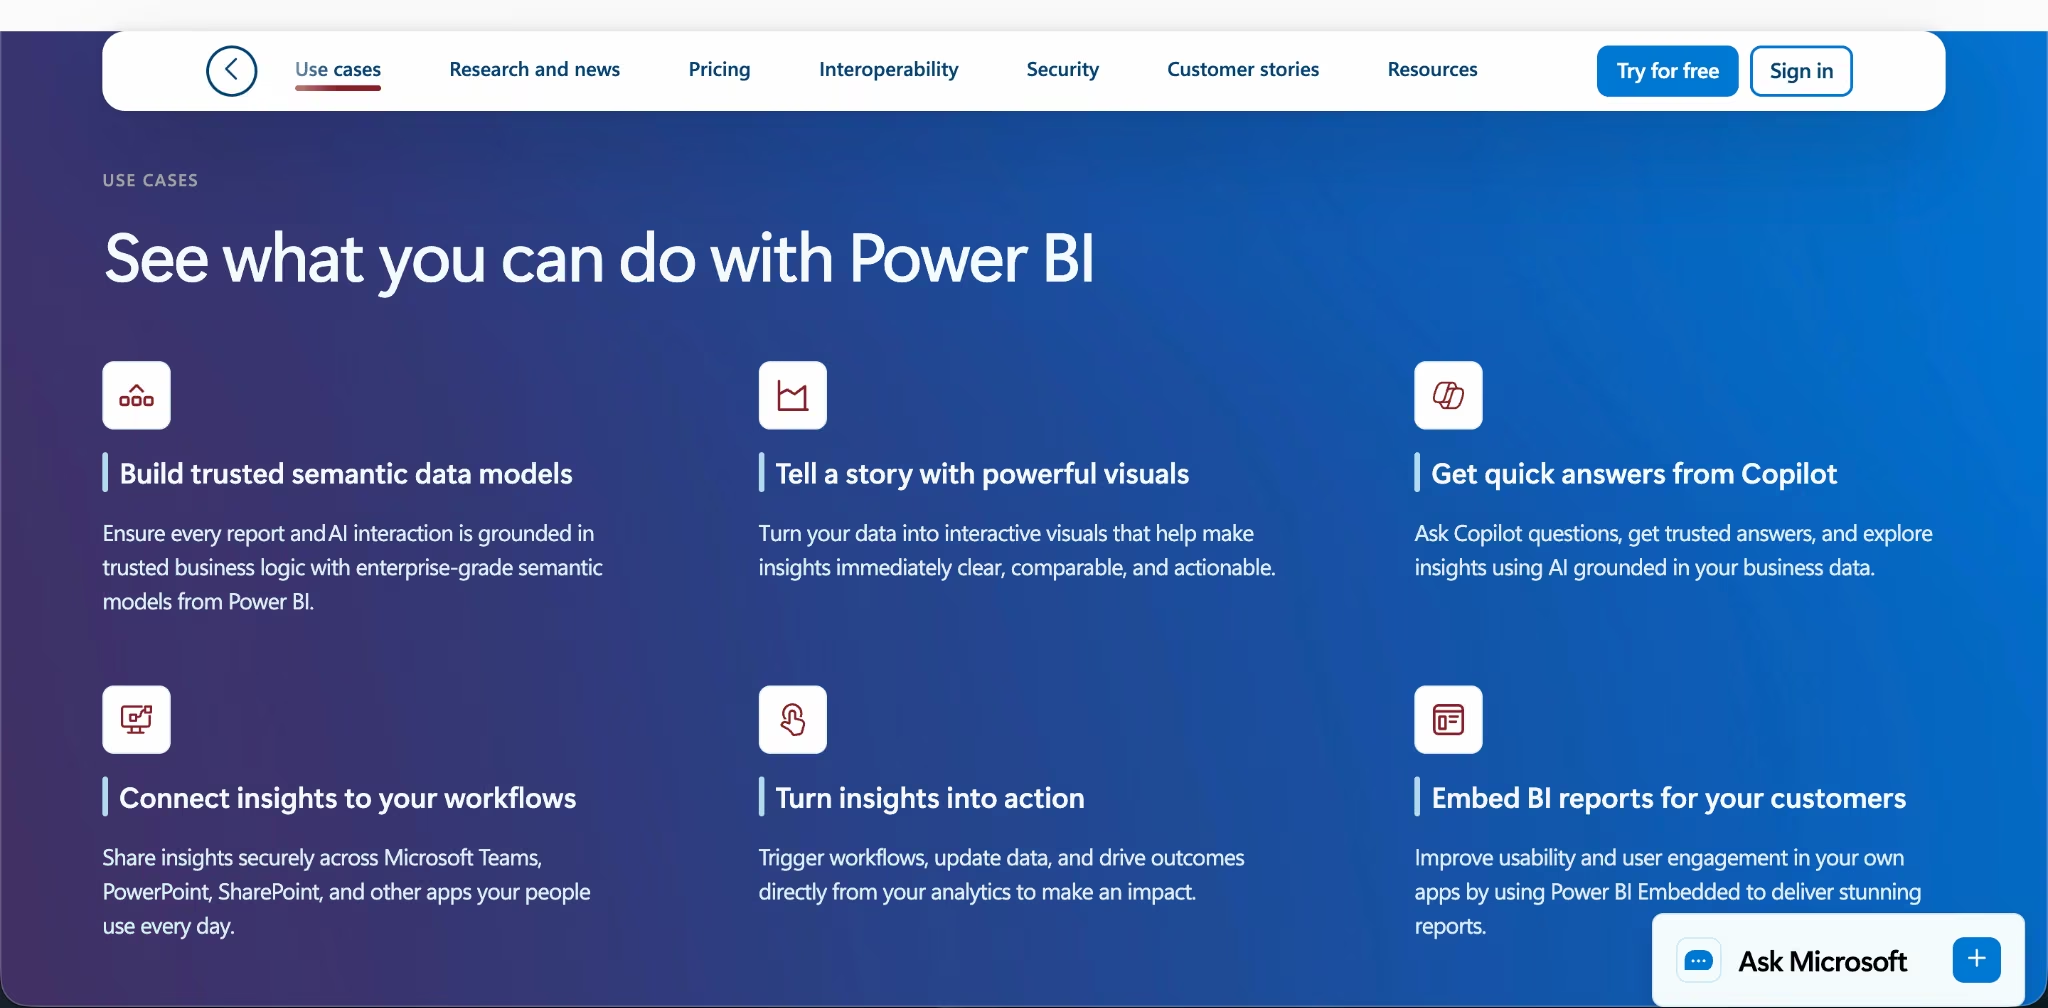
What it does: Power BI helps you create reports, publish dashboards, share analytics, and manage business intelligence inside the Microsoft ecosystem.
Best for: Teams already using Excel, Microsoft 365, Teams, Azure, Fabric, SQL Server, and Microsoft identity tools.
With Power BI, the decision hinges on your existing stack more than the build itself, so I weighed it on how cleanly it fits a Microsoft environment, what the licensing really costs once you add sharing, and where it slows down non-technical teams.
Power BI is the best dashboard builder for Microsoft-heavy companies. If your data starts in Excel, SQL Server, Fabric, Azure, or Microsoft business apps, Power BI keeps reporting close to the systems your team already uses.
The free account lets you create reports, and Power BI Desktop is available as a free download for report authoring. The paid Pro plan unlocks the collaboration layer most teams need: publishing, sharing, and working with reports across Power BI workspaces.
Power BI’s pricing is also hard to beat for Microsoft teams. Pro costs $14/user/month paid yearly, and Premium Per User costs $24/user/month paid yearly with larger model sizes and more frequent refreshes.
The tradeoff is usability. Power BI is powerful, but it feels more like a BI system than a lightweight dashboard builder. If your team is non-technical and not already committed to Microsoft, Zoho Analytics is easier to start with.
Key Features
- Microsoft ecosystem fit: Power BI fits teams already using Microsoft 365, Excel, Teams, Azure, Fabric, and related systems.
- Free report authoring: You can create reports with Power BI Desktop before paying for sharing and collaboration.
- Pro collaboration: Pro supports publishing and sharing Power BI reports across teams.
- Premium path: Premium Per User adds larger model sizes and more frequent refreshes for teams with heavier analytics needs.
Pros And Cons
Pros:
- ✅ Best dashboard builder for Microsoft-first teams.
- ✅ Low starter price compared with many BI platforms.
- ✅ Strong path from free report creation to enterprise analytics.
Cons:
- ❌ Sharing and collaboration require paid licensing.
- ❌ Setup can feel technical for non-analysts.
- ❌ Teams outside Microsoft won’t get the same ecosystem advantage.
Pricing
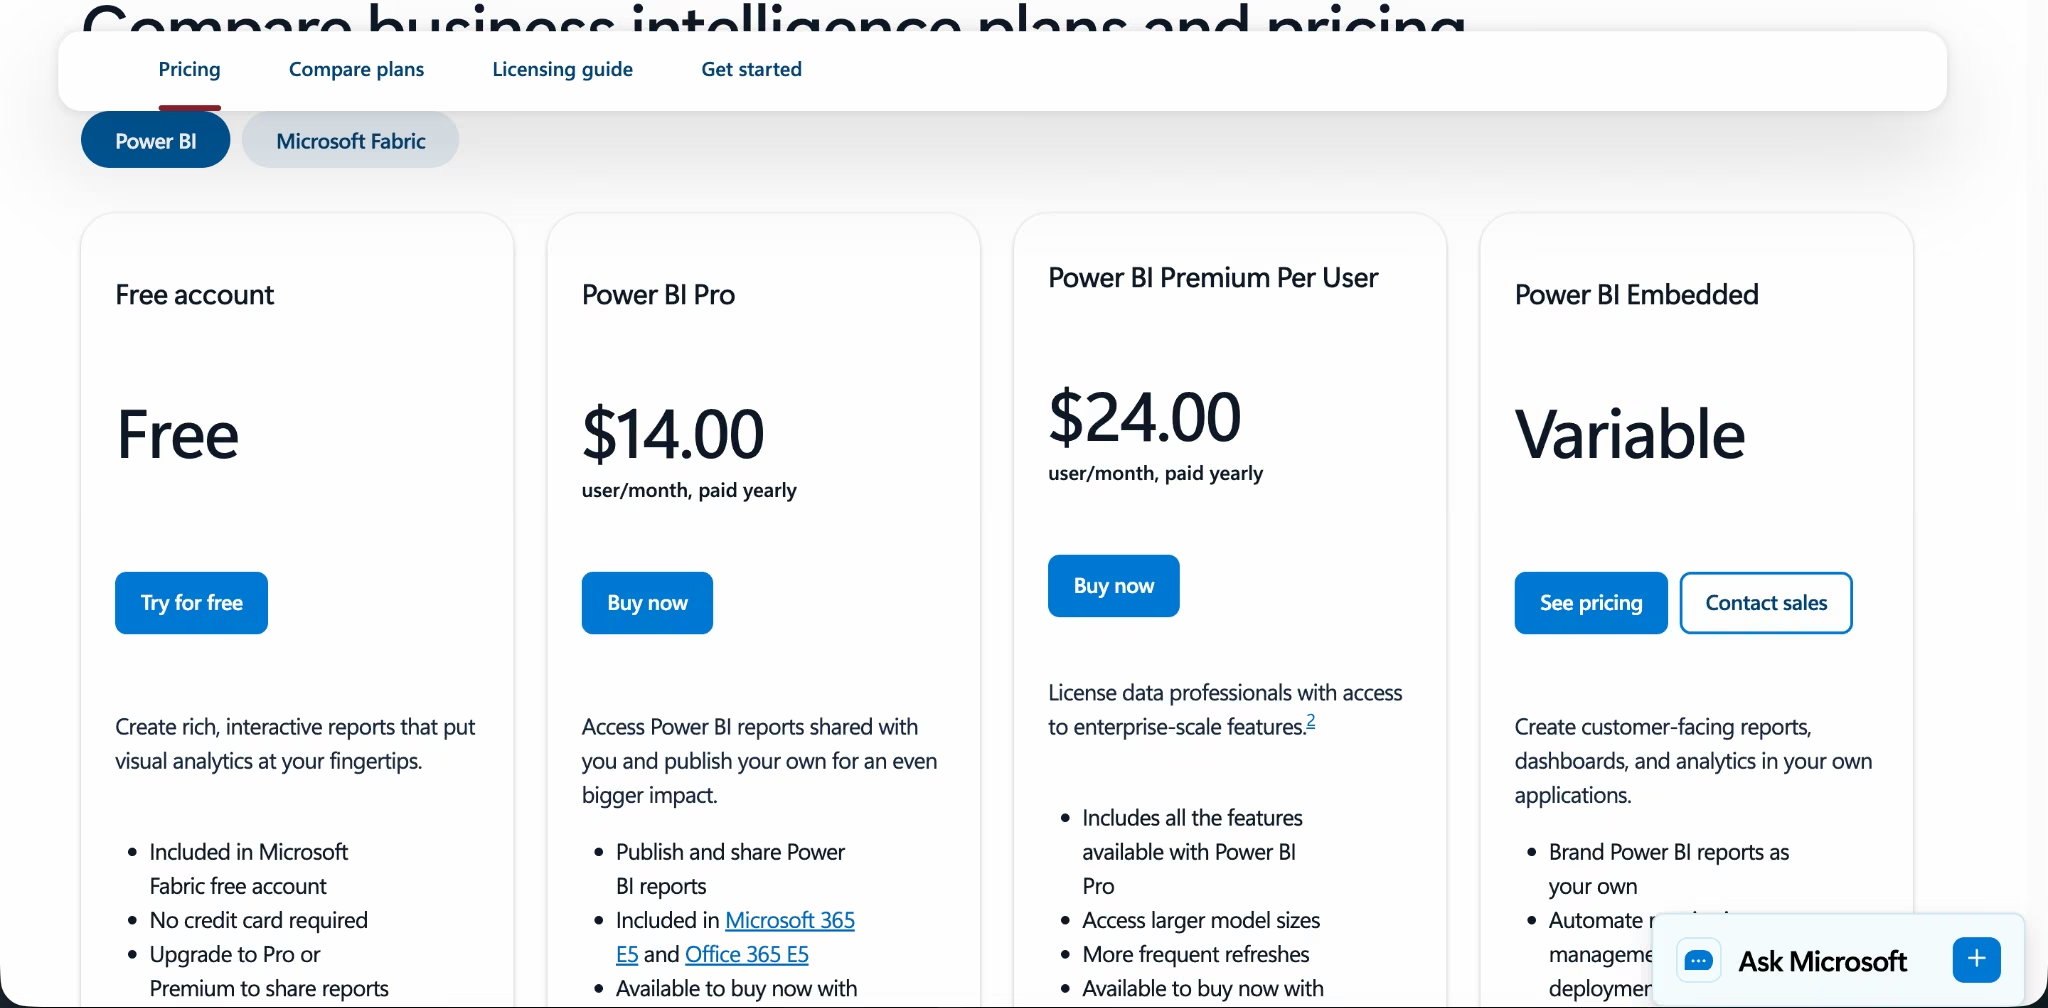
Power BI offers a Free account, Power BI Pro at $14/user/month paid yearly, Power BI Premium Per User at $24/user/month paid yearly, Power BI Embedded with variable pricing, and Microsoft Fabric capacity with variable pricing. Power BI Desktop is available as a free download.
Bottom Line
Choose Power BI if your team already lives in Microsoft tools and needs affordable BI dashboards. Skip it if you want the easiest dashboard builder for a small team working mostly in Google Sheets, HubSpot, or mixed business apps.
4. Zite: Best For Visibility And Control Over Your Dashboard Data
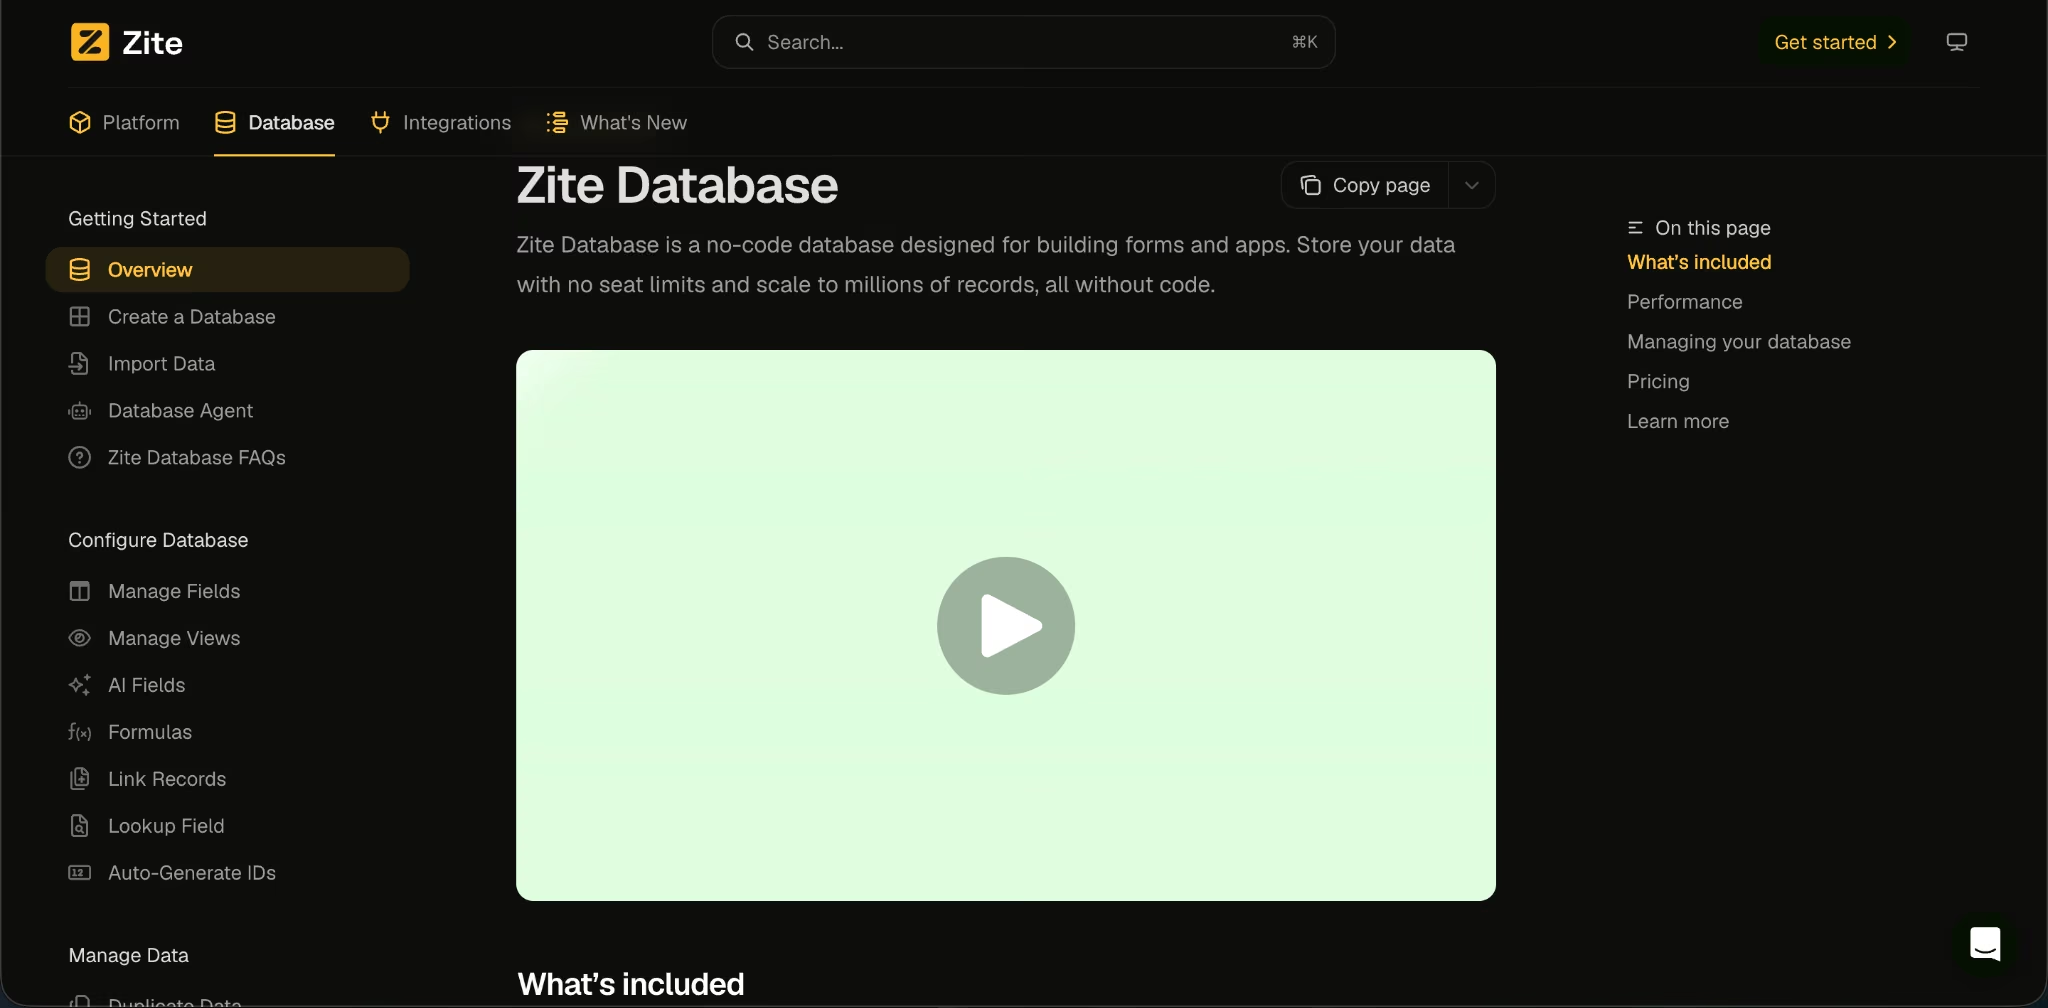
What it does: Zite builds custom dashboards, internal tools, and workflow apps over your existing business data or its built-in database.
Best for: Non-technical operations teams, agencies, consultants, and small businesses that want to inspect their data and understand what the dashboard does behind the scenes.
Zite’s strongest point is visibility. Many AI builders can generate a dashboard, but the non-technical person who owns it still needs answers to two questions: “What data is this using?” and “What happens when someone clicks this button?”
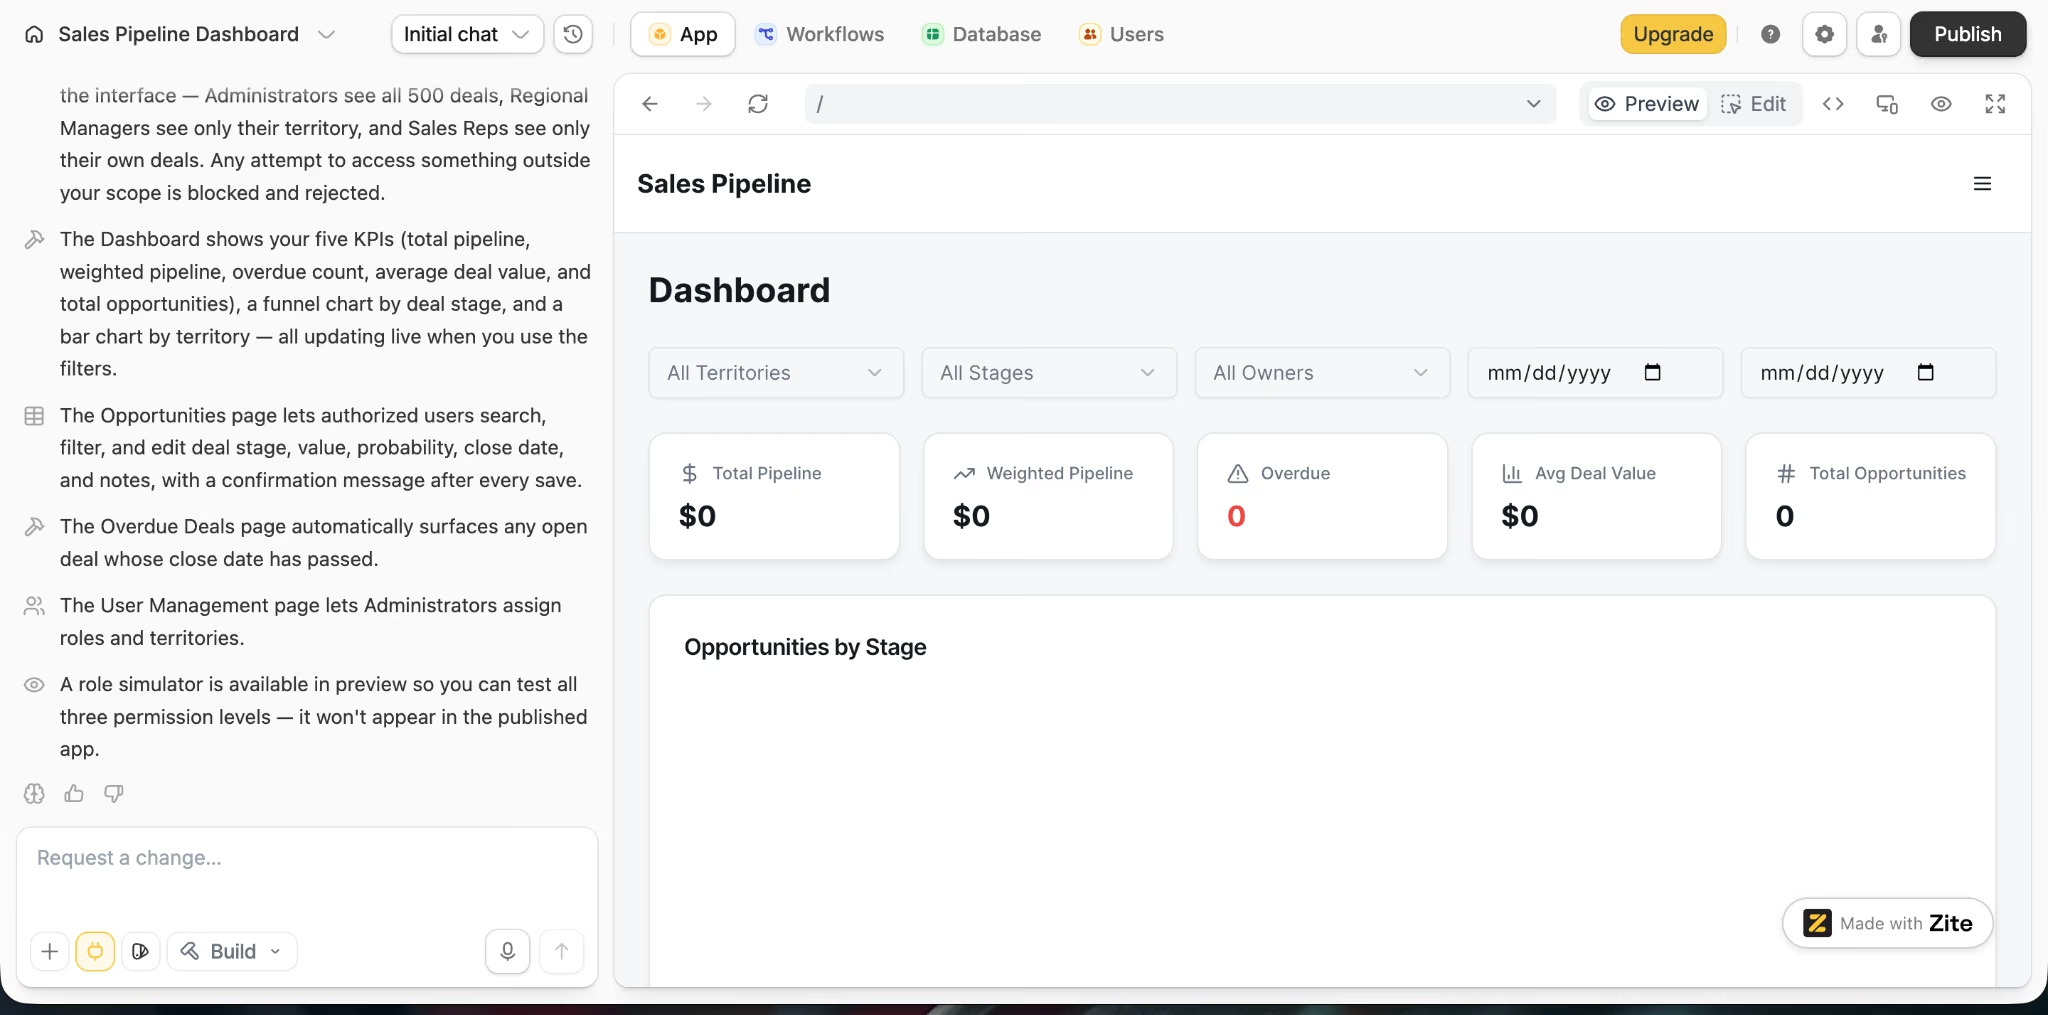
I built the same sales pipeline dashboard in Zite around 500 opportunity records across four territories. The app included three role types, four pages, five KPI cards, two charts, four filter dimensions, and an editable opportunities table with five updatable fields.
Zite created invite-only access through two sign-in methods, Google and magic link. Administrators were configured to see all 500 records, while regional managers and sales representatives received narrower access based on territory and record ownership. Zite also added a preview-only role simulator so I could inspect all three permission levels without exposing that control in the published app.
The dashboard interface was created, but the preview screenshot still showed $0 total pipeline, $0 weighted pipeline, zero overdue deals, $0 average deal value, and zero total opportunities. That means I couldn’t treat the data calculations or charts as fully verified from this build state.
The Slack notification was also incomplete. Zite paused the notifyOverdueOpportunity workflow and asked for a real Slack connection instead of mocking the result, so zero Slack messages were sent, and one requested feature remained unfinished.
My verdict: Zite gives non-technical teams a clear structure for role-based dashboards, editable records, and visible workflows, but this build wasn’t ready for a final pass until the database values appeared in the preview and the Slack connection was completed.
Zite keeps those answers within reach.
Its built-in database uses a spreadsheet-like interface with tables, fields, filters, saved views, bulk edits, linked records, and formulas.
Underneath that familiar interface is a database designed to scale to millions of records, with granular permissions, application programming interface (API) access, webhooks, and more than 20 field types.
The same visibility applies to app logic.
Zite’s workflow editor has a visual Preview tab, a Code tab showing the TypeScript behind the workflow, and a History tab with execution logs.
You don’t need to understand TypeScript to use the workflow, but you can inspect the steps, check whether a run succeeded, see how long it took, and identify where a process failed.
That makes Zite a strong fit when your data already exists, but your team needs a better way to work with it. You can import information from CSV files, Google Sheets, or Airtable, connect external services, and build a dashboard that reads and updates the records instead of trapping them inside a static report.
For example, an operations team could build a pipeline dashboard over its own customer data, add filters for territory and deal stage, let account managers update records, and trigger a Slack alert when an opportunity becomes overdue. The team gets a cleaner interface without losing access to the underlying records or the workflow handling each update.
Zite is less suitable for analyst-heavy data modeling, complex SQL work, or a public software product that needs full source-code ownership and custom infrastructure. It’s built around business apps, dashboards, internal tools, portals, and operational workflows.
Key Features
- Spreadsheet-like database: You can inspect, filter, edit, import, and organize the records behind your dashboard through a familiar table interface.
- Visible workflow logic: The visual workflow, TypeScript code, and execution history show how the app reads data, updates records, and triggers actions.
- Your existing data: Zite can work with Zite Database, Airtable, Google Sheets, Salesforce, and other business systems instead of forcing you to rebuild everything first.
- Unlimited users and apps: Every plan includes unlimited users, editors, apps, and databases, so sharing a dashboard doesn’t create a new per-seat bill.
Pros And Cons
Pros:
- ✅ Gives non-technical teams direct visibility into dashboard data and workflow logic.
- ✅ Combines dashboards, forms, databases, permissions, and workflows in one product.
- ✅ Unlimited users and apps keep costs predictable when a dashboard needs broad access.
Cons:
- ❌ Not designed for heavy data modeling or complex SQL analysis.
- ❌ Zite hosts the app, and it doesn’t provide full source-code export.
- ❌ Credits, database records, workflow runs, and storage limits vary by plan.
Pricing
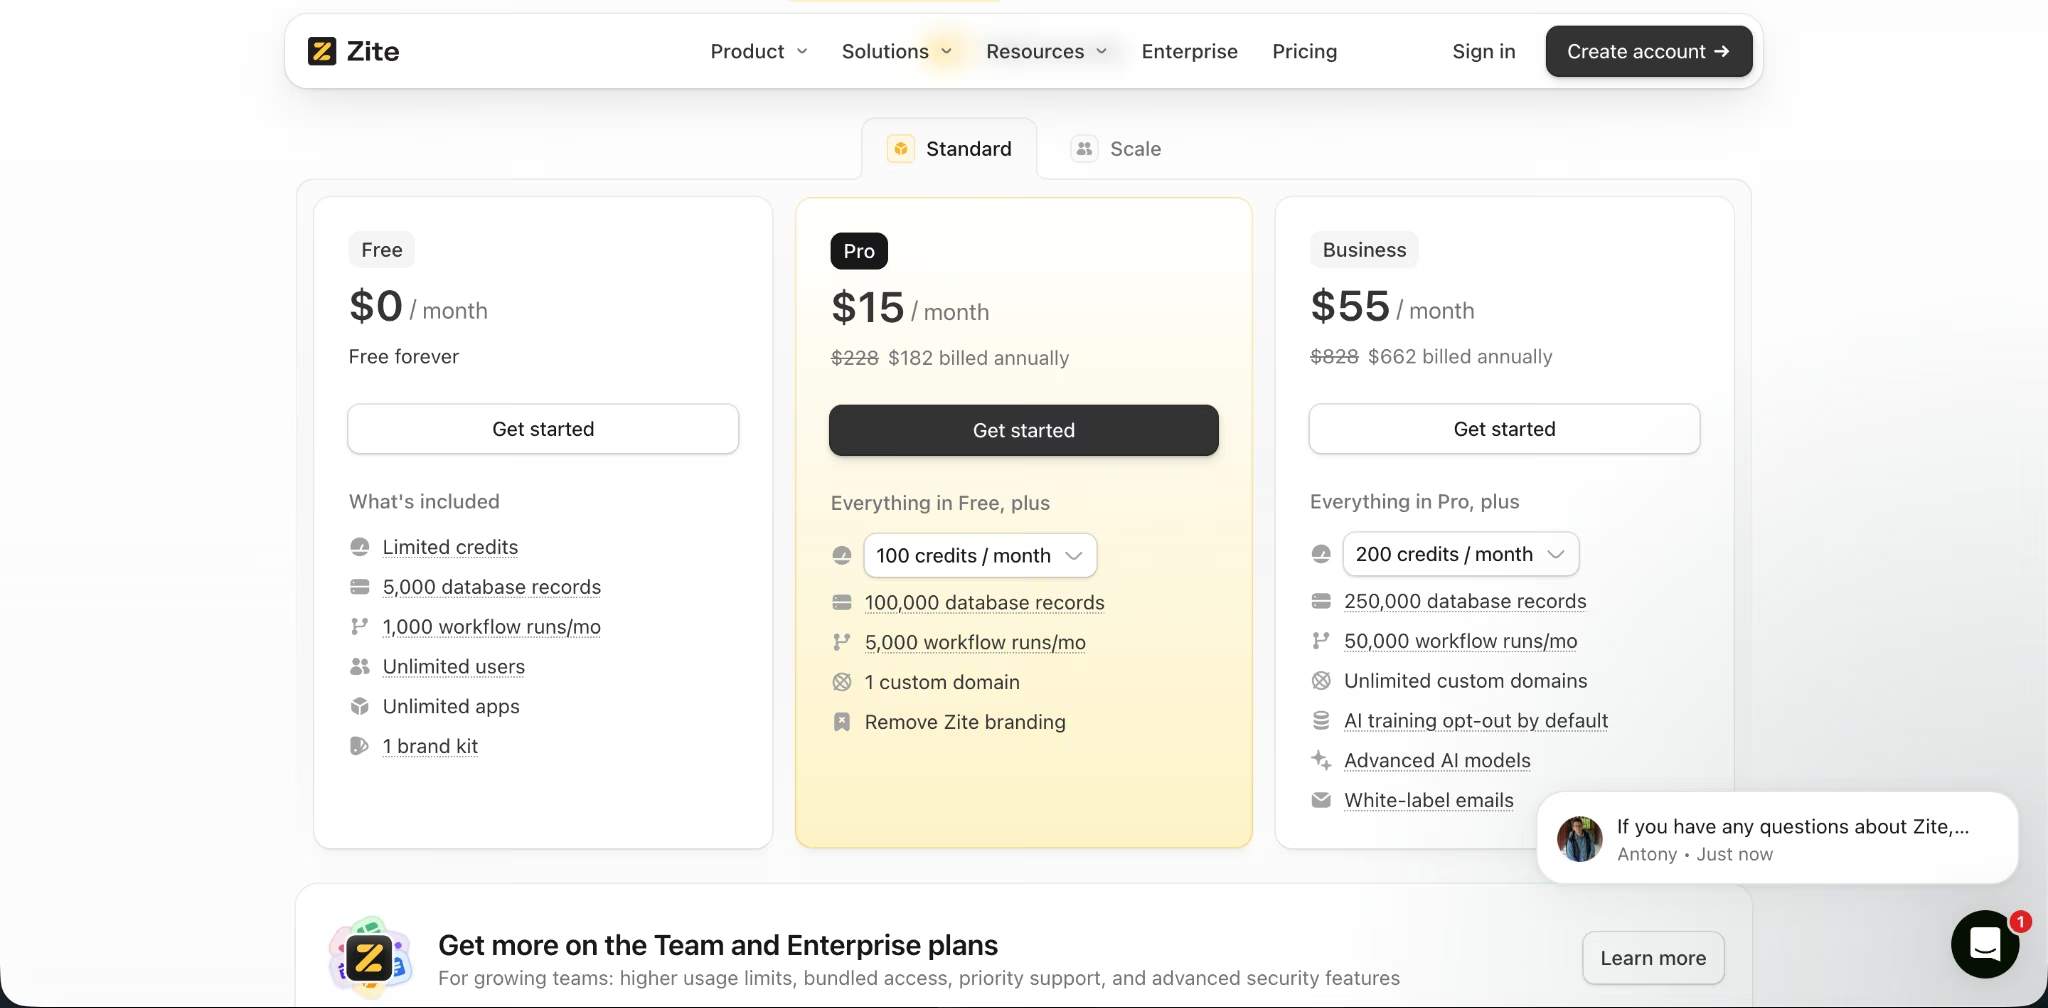
Zite offers Free at $0/month, Pro at $19/month ($15/month billed annually), Business at $69/month ($55/month billed annually), Team at $300/month ($250/month billed annually), and Enterprise with custom pricing. The Free plan includes 50 monthly credits, 5,000 database records, 1,000 workflow runs, and unlimited users and apps.
Bottom Line
Choose Zite if you want a custom dashboard over your own data while keeping the records, permissions, workflow steps, and backend logic visible. Choose Emergent when you need a broader custom product with more control over the generated code and future developer handoff.
Other Tools Worth Checking Out
- Looker Studio (formerly Google Data Studio) is the best free option for Google-first reporting because it offers drag-and-drop reports and works well with Google Sheets, Google Ads, BigQuery, and Google Analytics. Pricing starts at no charge, while Looker Studio Pro costs $9/user/project/month. I kept it out of the top four because it works better for free reporting than full business BI or custom dashboard apps.
- Tableau is excellent for visual analytics, governed collaboration, Tableau Pulse, Tableau Desktop, and analyst-led exploration. Pricing starts at $15/user/month billed annually, and I kept it out of the top four because it is heavier and more analyst-centered than most dashboard-builder buyers need.
- Databox is strong for marketing, sales, and executive KPI dashboards, with 130+ integrations, AI credits, scorecards, alerts, templates, and dashboard sharing. Pricing starts with a Free plan, Analyst costs $80/month ($64/month billed annually), and I kept it out of the top four because it is better for performance reporting than broader BI or custom dashboard app building.
- Geckoboard is the best pick for live team dashboards on shared screens, with real-time updates, Slack and Microsoft Teams snapshots, dashboard loops, mobile access, alerts, and drilldowns. I kept it out of the top four because it is built for live visibility, not deep analysis or custom app workflows.
- Retool is powerful for internal dashboards that need actions, database edits, workflows, mobile apps, authenticated embedded apps, and role-based permissions. Pricing starts with a Free plan. Team costs $12/builder/month ($10/month billed annually), plus $7/internal user/month ($5/month billed annually). I kept it out of the top four because it fits technical internal-tool teams better than non-technical dashboard buyers.
- Domo is a strong enterprise BI platform with dashboards, embedded analytics, low-code apps, workflows, Domo AI, unlimited users, and credit-based consumption pricing. Domo offers a 30-day free trial and custom paid pricing, and I kept it out of the top four because smaller teams usually need clearer public pricing and a faster buying path.
If you'd rather see the broader field, this breakdown of application development tools gives a single verdict on each.
Skip this category entirely if you need a regulated production system with sensitive personal, financial, health, legal, or child-related data and no technical reviewer. AI and BI tools can speed up the first version, but they don’t replace security, privacy, and compliance review.
If you're building for internal operations rather than customers, compare the best custom business software tools instead.
Final Verdict
The best dashboard builder for most business teams is Zoho Analytics because it gives you the strongest mix of dashboard depth, AI support, data connections, free-plan access, and SMB-friendly pricing.
Power BI wins when Microsoft is already your reporting backbone. Go with Emergent when your dashboard needs to become a working app with users, workflows, roles, and launch support. Pick Zite when you want a custom dashboard over your own data with a spreadsheet-like experience and clear visibility into the logic behind it.
Use Emergent to create a custom dashboard app with forms, permissions, workflows, and business logic. Build your dashboard with Emergent.

Most AI app builders stop at prototypes. Emergent creates production-ready apps you can actually launch.
- Production-ready apps
- Web & mobile apps
- Deploy in minutes