Most sales teams already have the data they need, but it sits in the CRM and gets pulled together by hand. A sales performance dashboard puts it on one screen, so managers and reps can see where they stand and what to do next.
This guide covers the KPIs to track, how the data layers work, and how to build the dashboard step by step without code.
What Is a Sales Performance Dashboard?
A sales performance dashboard is one screen that shows how a sales team performs against its targets. It pulls deal, activity, and revenue data from your CRM and other systems. It then displays that data as cards, charts, and tables.
A sales performance tracking dashboard does three things:
- Shows the current status of quota, pipeline, and forecast.
- Shows which stage, rep, or deal is causing results to fall below target.
- Helps managers decide which reps to coach or deals to review next.
Microsoft's dashboard design guidance treats a dashboard as an overview of the current state. Detail stays in the underlying reports. That split keeps the screen readable.
What Should a Sales Performance Dashboard Include?
Choose five to seven sales dashboard KPIs for each role. Set a target and time period for each one. Fewer numbers make it easier to take action.
Use the same time periods and groups when calculating percentages. If the remaining quota is zero or less, show ‘Target met’ instead of dividing by zero.
Pipeline coverage depends on your win rate. As a rough estimate, a 25% revenue conversion rate needs 4× coverage, while 20% needs 5×. Deal-count win rate is only a rough guide when deal sizes are similar.
Use both types of KPIs
Lagging KPIs show what has already happened, like quota attainment, win rate, and average deal size. Leading KPIs indicate what may happen next, based on pipeline created, lead response time, and activity count.
How a Sales Performance Dashboard Works: The Architecture
A practical sales-dashboard architecture has five layers. Data moves from the source systems to the screen. If any layer fails, the numbers may be wrong.
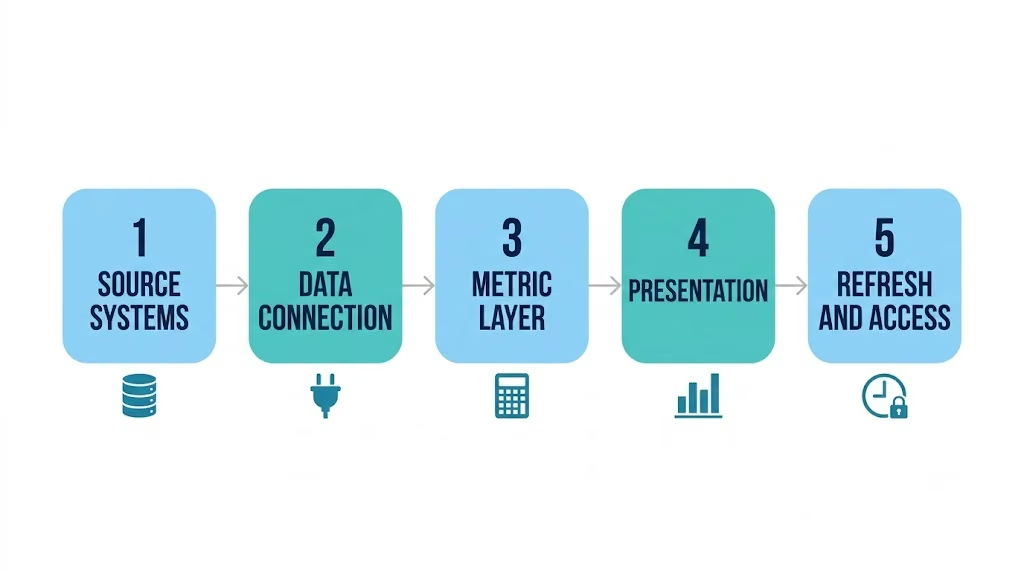
Data quality affects all five layers. Gartner’s 2020 research says poor data quality costs the average organization at least $12.9 million a year. A dashboard helps you spot bad CRM data faster, but it does not fix it.
An AI app builder can help implement data connections, KPI calculations, dashboard views, and access controls. Your team still owns data quality, metric definitions, and validation.
How to Build a Sales Performance Dashboard: Step-by-Step
The first three steps make sure the numbers are reliable. Steps 4 and 5 help people use them.
Step 1: Define the decisions and the audience
Decide who will use the dashboard and what they need to decide. A sales manager checking the pipeline on Monday needs to know which deals to check and whether to change the forecast. Keep panels that help with these decisions and remove the rest.
Step 2: Choose KPIs and lock their definitions
Select five to seven KPIs from the table above and briefly explain how each is calculated.
The team should also have a shared understanding of when a deal is considered won, whether deals without a next step belong in the pipeline, and when the sales cycle begins. Keep these definitions accessible to everyone.
Step 3: Bring in your CRM data
The CRM should have details such as who owns each deal, its stage and amount, and when it was created or closed. Check a data export to see if any fields are missing or repeated.
Fix any missing CRM data, then choose how it will reach the dashboard: an API connection or a scheduled import. If the data isn’t ready, plan to start with sample data. If the CRM itself is the weak layer, you can build a sales CRM around the fields and stages your team actually uses.
Step 4: Design a sales dashboard for managers and reps
Create two views. Reps need to see open deals, progress toward their quota, and tasks due. Managers need to see team sales targets, pipeline coverage, conversion at each stage, and stalled deals.
Microsoft’s layout guidance applies to both views:
- Put the main number, such as quota attainment, at the top left.
- Fit everything on one screen so people don’t have to scroll.
- Use the same time period for every chart.
Step 5: Automate updates and alerts
Refresh the data as often as needed for daily decisions. Update worklists before people start using them each day. Forecasts may need more frequent updates near the end of a quarter or when major deals change. Set alerts for deals with no recent activity that need follow-up. If you want the follow-up itself handled, you can build a sales agent that drafts the nudge for the rep to review.
Step 6: Build, test, and launch the dashboard without code
Steps 1-5 give you the plan. Emergent, a vibe coding platform for building full-stack applications, can turn it into a working dashboard without code. Its AI agent builds from your prompt, so the definitions from Steps 1-2 do most of the work.
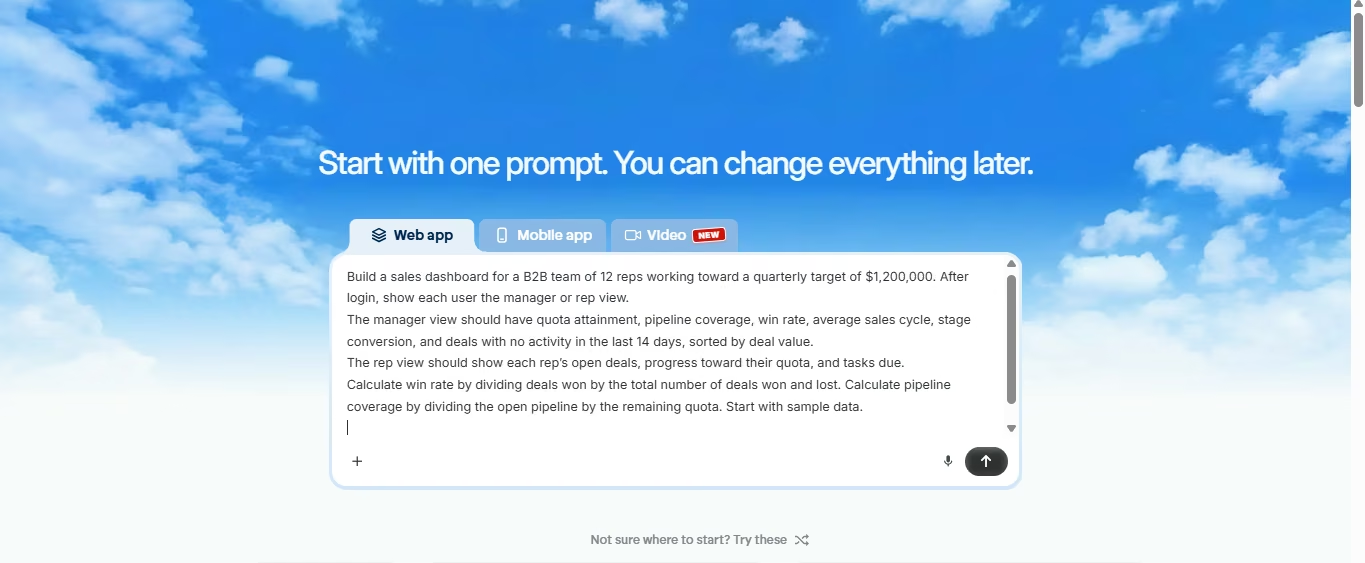
Describe the dashboard: Log in to Emergent and paste your audience, KPIs, and definitions from Steps 1-2 as one prompt, for example:
Build a sales dashboard for a B2B team of 12 reps working toward a quarterly target of $1,200,000. After login, show each user the manager or rep view.
The manager view should have quota attainment, pipeline coverage, win rate, average sales cycle, stage conversion, and deals with no activity in the last 14 days, sorted by deal value.
The rep view should show each rep’s open deals, progress toward their quota, and tasks due. Win rate is the share of won deals out of all won and lost deals. Pipeline coverage shows how much of the remaining quota is covered by open deals. Try both calculations with sample data to make sure they work correctly.
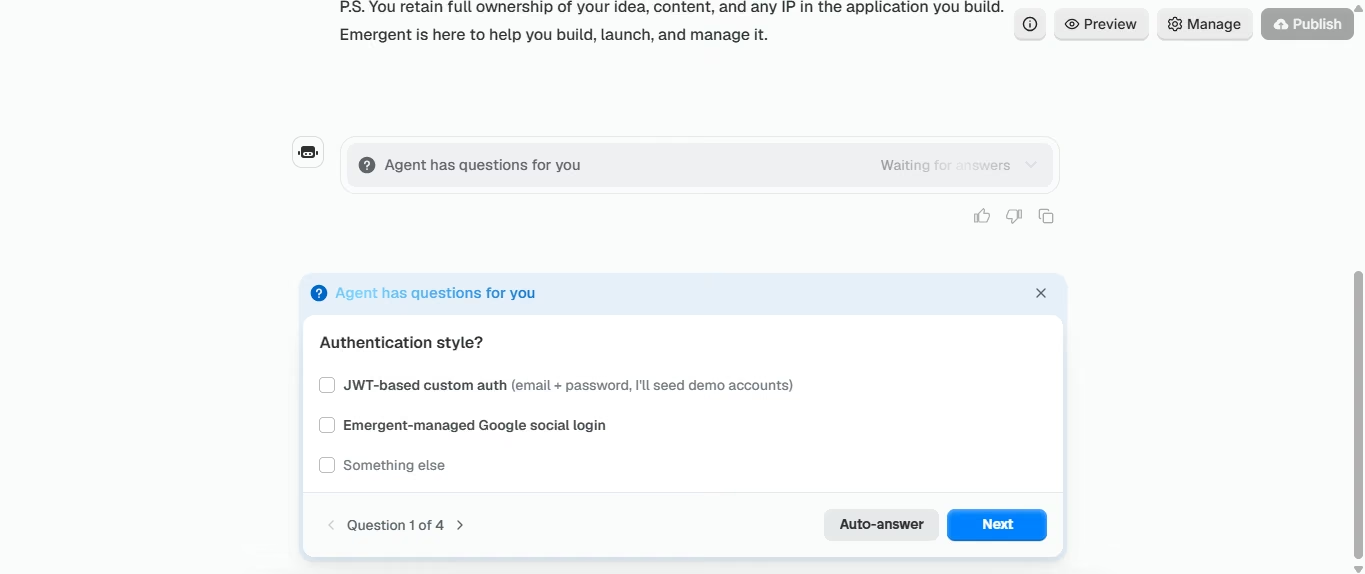
Answer the scoping questions and approve the plan: Before building the app, the agent needs to know whether you want a web or mobile version, how users will sign in, where the data will come from, how you measure deal health, and whether you have sample data. Once you provide these details, it puts together a build plan. Before you approve it, make sure the plan covers your KPI list.
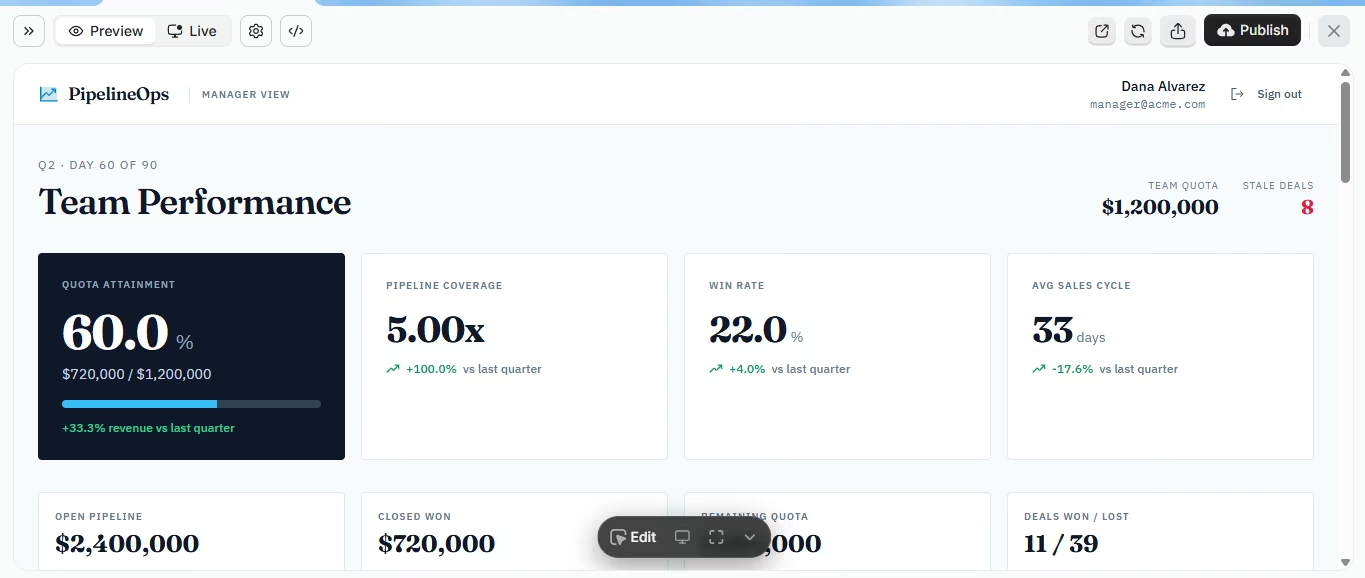
Preview with sample data: Click Preview and check that the manager view shows every KPI on your list. Calculate two or three numbers yourself and compare them with the dashboard.
Replace sample data with live deals: Ask the agent to replace sample data with live deals through the CRM’s API. Map the fields from Step 3, including each deal’s ID, owner, stage, amount, dates, and stage history. Compare imported totals with the CRM, apply the refresh schedule from Step 5, and show when the last sync succeeded.
Restrict access by role: Sales reps should only be able to see their own records, while managers should have access to everyone's records. Test both account types to confirm a rep cannot view another rep's deal through a direct link.
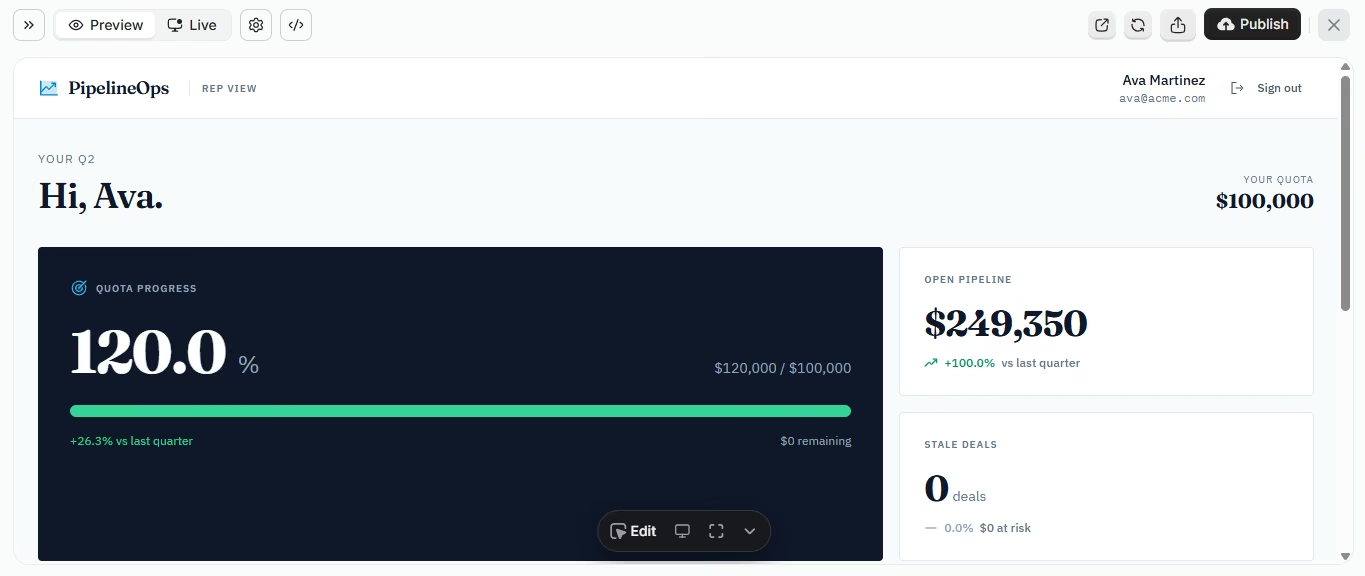
Publish and assign an owner: Click Publish next to Preview, run the Health Check, and start the deployment. Test the live connections once it is published. Launch with one team and run it on a week of real data before expanding. Choose someone to fix broken data feeds and answer questions, and after 30 days remove the panels nobody opens.
Sales Performance Dashboard Example
These are example numbers for a B2B software team with 12 reps. The quarterly quota is $1,200,000, and the team is on day 60 of its 90-day quarter.
Attainment is about seven percentage points behind a straight-line pace; actual sales may not close evenly through the quarter.
Coverage appears sufficient under these assumptions, but the manager should review the nine stalled deals before setting any new prospecting targets.
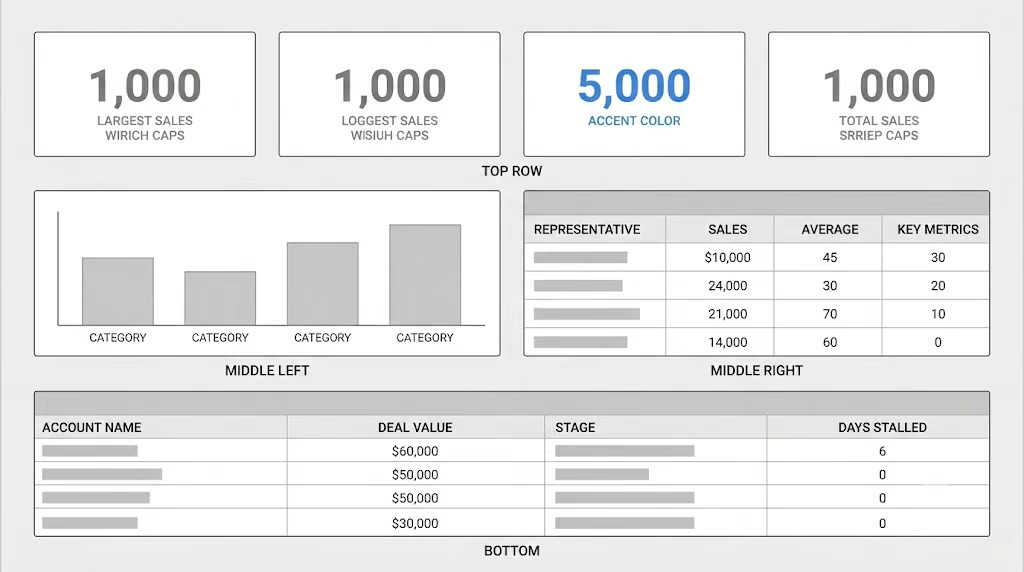
Sales performance dashboard template layout
Copy this layout as a starting sales performance dashboard template. Replace the sample metrics with your own KPIs.
Common Mistakes to Avoid When Building Sales Dashboards
- Tracking activity without outcomes: Reps may make more calls just to meet the target. Track each activity with a result, such as meetings booked for every 100 calls.
- Using pie or gauge charts to compare values: Microsoft's guidance says bar and column charts work better, because people compare bars side by side.
- Showing a forecast no one can trace: Build the forecast from stage conversion history so every number links back to deals.
- Blending every deal into one average: A single win rate hides the gap between small deals that close fast and large deals that stall. Split results by deal size or segment.
- Designing only for a desktop monitor: Microsoft notes that fewer tiles read better on tablets and phones. Check the manager view on a phone.
- Showing numbers without context: A $720,000 figure means little on its own. Add the target and the prior period beside it.
Conclusion
A sales performance dashboard is useful only if each panel helps the team make a decision. Agree on what each number means before building the dashboard to avoid confusion later.
Key Takeaways:
- Start with the decisions the team needs to make. Then choose five to seven KPIs and write down what each one means.
- Plan all five layers and clean the CRM data before connecting it.
- Create separate views for managers and reps. Set updates based on how often each decision needs new data.
- Test the dashboard using a real week of data, assign someone to manage it, and check how the team uses it after 30 days.
Ready to build? Take the KPI list and definitions from Steps 1-2 and describe the dashboard to Emergent’s AI dashboard builder. The same approach works for teams that build custom internal software for other departments.


Most AI app builders stop at prototypes. Emergent creates production-ready apps you can actually launch.
- Production-ready apps
- Web & mobile apps
- Deploy in minutes