Every creator account I've handled comes with a version of a creator dashboard, and none of them can answer the one real question after a partnership wraps: was it worth it?
It came up again the week one of my creator clients wrapped a partnership, and I pulled up their TikTok creator dashboard for an answer. It showed views. It showed followers. It said nothing about what they were paid, or whether that beat their last three partnerships.
So I spent eight days running that exact brief through five tools, picked out of 14 I looked at first. The fastest had a working dashboard back in under 20 minutes. The slowest took the better part of an hour, since almost nothing about it happened without a manual pass.
Which of the five fits you comes down to one thing: whether it stores your data, or only dresses up numbers that already live somewhere else. By the time you're through, you'll know exactly which does which, and which one fits a solo creator with no analyst or developer on call.
Why a Platform's Own Creator Dashboard Isn't Enough
Every platform I post on has its own creator dashboard. Twitch, TikTok, and YouTube all have one. Each shows you earnings from its own monetization program (ad revenue, Twitch's Sponsorship Portal, TikTok's Creator Rewards) alongside audience metrics like views and followers.
None of them can answer the question that decides whether a brand deal was worth taking: How much it paid relative to your audience's growth. That number lives in two places.
None of those platforms track a deal negotiated off-platform, and no platform's native analytics dashboard was built to combine an outside deal's dollar amount with your own audience-growth numbers in one view.
What you need is a tool that pulls numbers from more than one source into a single view. You hit a fork almost immediately.
Some tools are genuine visual dashboard builders that let you collect and own the data. Others only display data living elsewhere. Get that wrong, and you'll spend weeks writing formulas you've never touched.
Of the five tools ranked here, Zite and Emergent store your records in their own built-in database. Softr's build here connected to an external Airtable base instead, since Softr's own native database option, Softr Databases, wasn't the one tested.
Databox keeps a synced local copy of whatever it connects to, and Data Studio queries live with no stored copy of its own.
How I Evaluated 14 Creator Dashboard Tools
I evaluated 14 creator dashboard tools before narrowing this list to the five here, testing the ones that fit the budget and offered self-serve access with the same brief, and screening out the rest on sight. Here's that brief:
Build me a personal brand-deal performance dashboard I can check in under a minute and share with two different audiences. Connect it to two data sources: A monthly brand-deal log (deal name, brand, dollar amount, status: In progress, completed, or canceled) and a monthly audience log (subscriber count, engagement rate). Show four summary numbers above the fold, visible without scrolling on a laptop screen: Total revenue this quarter, number of active deals, subscriber growth versus last month, and average revenue per completed deal. Total revenue must exclude any deal marked canceled, but the deal list below it still needs to show canceled deals so I can see the full history, not just the ones that count. Add one trend chart of revenue by month and one sortable table of individual deals. I need two separate share links from the same dashboard: One for brand partners that shows deal status only, with no dollar amounts visible, and one for my accountant that shows the same deals with the dollar amounts included, both pulling from the identical underlying data so the numbers never drift apart. The dashboard has to refresh on its own at least once a day when I update the source spreadsheet; I'm not manually re-uploading a file every time a deal closes. And I need an honest answer on the exit: If I stop paying for this tool in a year, can I still get my raw data out as a CSV, and does a link I shared today keep working, or does it just die?
That brief is hard on purpose. It has a measurable constraint (four cards, zero scrolling) and a trap, since canceled deals vanish from one number but stay visible below. The same planning order applies when building an analytics dashboard with AI: define the decision, metrics, data sources, and access rules before generating the interface.
That four-card format is the same one any KPI dashboard needs to work at a glance.
Nine tools didn't make the final five. Power BI needs data-modeling knowledge. Zoho Analytics' SQL layer for advanced data prep carries a steep learning curve, past what this brief needed.
Domo's trial is self-serve, but its ongoing plans need a sales call. Tableau's tiers run $15/user/month to $35/user/month, and Grafana is built and marketed for infrastructure monitoring first.
Geckoboard's price ruled it out; Whatagraph's plans are priced for multi-client agency reporting, well past a solo creator's budget; Klipfolio's curve shows up past one source; and Metabase's free self-hosting means setup work.
I spent eight days on cold accounts, measuring data ownership, setup speed, the canceled-deal exception, and audience masking.
All five reached a working version in under an hour, though Data Studio and Databox needed more manual work per summary card than the prompt-driven builders did. Emergent took 19 minutes, Zite 20, Databox 30, Softr 35, and Data Studio 45.
How the five stack up:
1. Zite: Best for Owning the Data It Displays
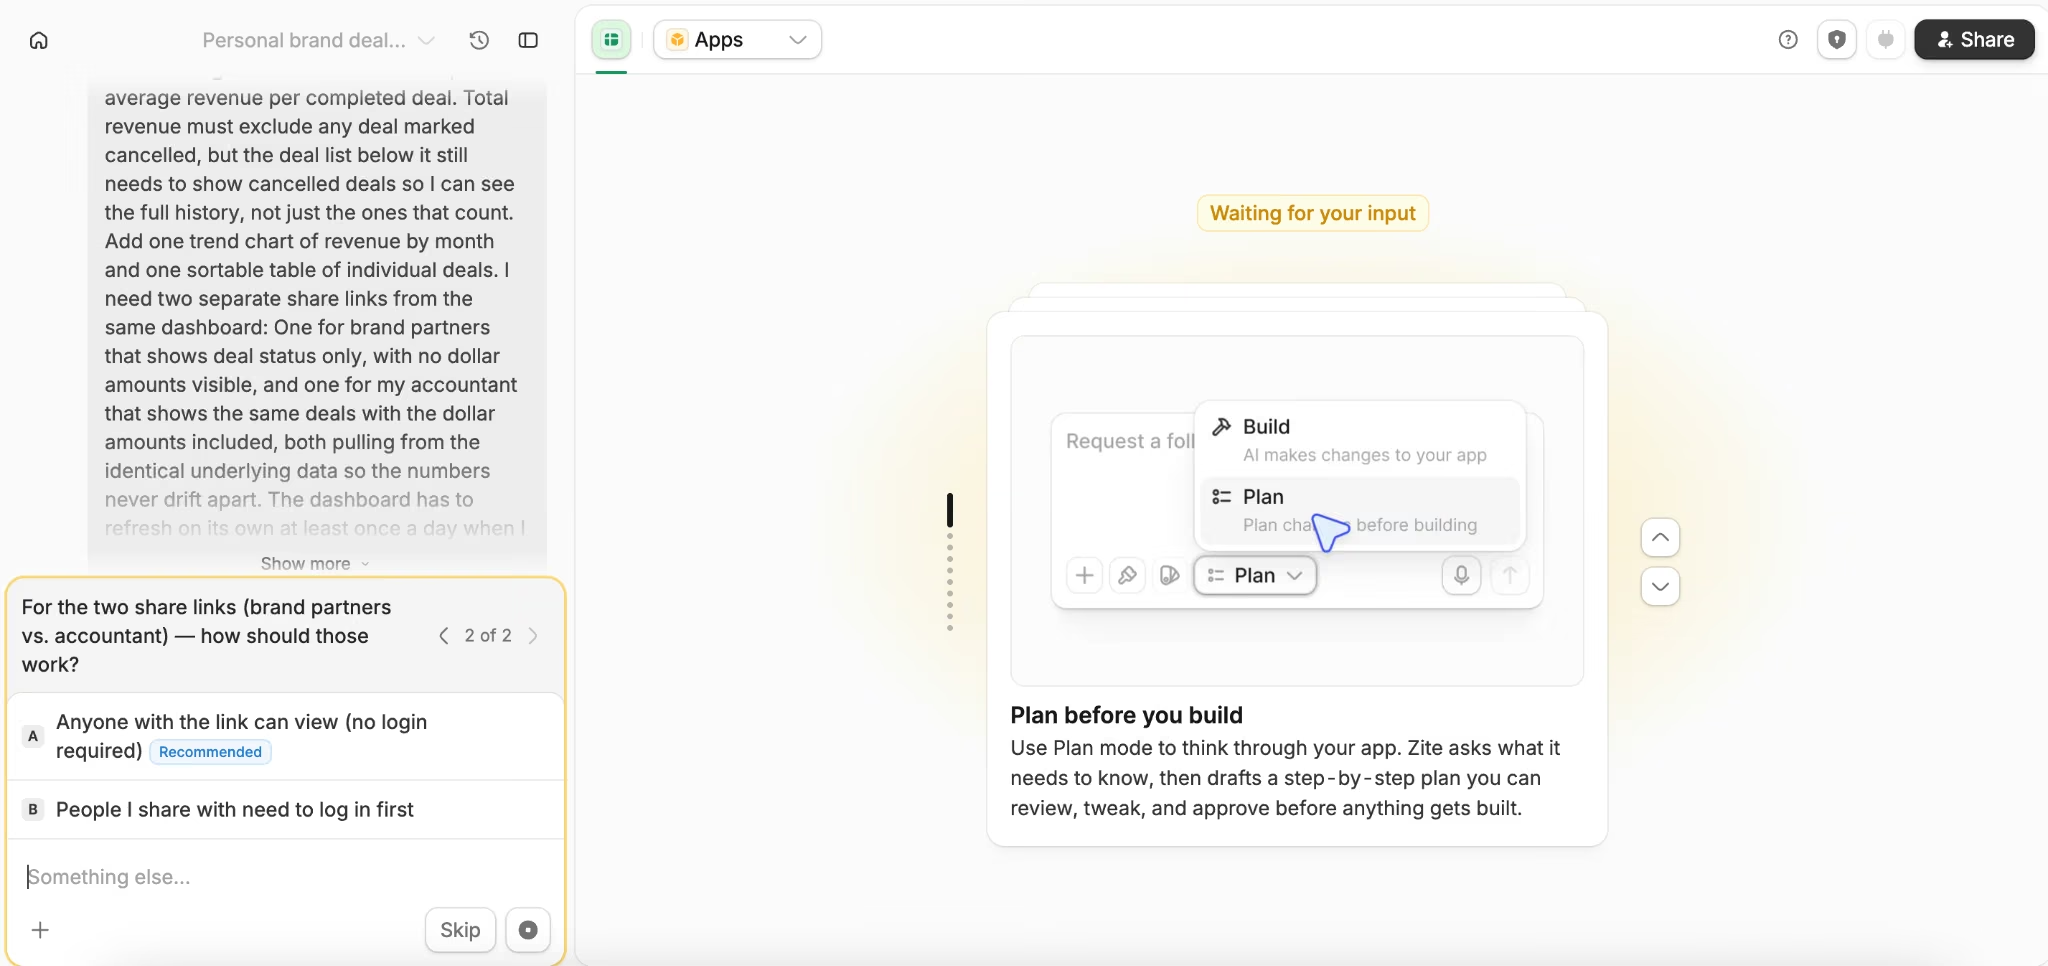
What it does: Zite is a visual AI app builder that turns a written description into a working dashboard.
Best for: A creator who wants one tool that collects and displays records.
I connected the brand-deal log and the audience log as two linked data sources first, and the four summary cards came together fast. I dragged fields into place with no formulas to write, and the canceled-deal exclusion rule worked on the first attempt.
I set a filter condition on the revenue card alone, without touching the deal-list table underneath it. 20 minutes in, I had a working four-card dashboard, well inside the hour I'd budgeted.
Once the dashboard was up and running, three other things stood out:
- Share links needed one manual step: Zite's sharing panel defaults to one link showing everything, so hiding dollar amounts on the partner-facing link meant hiding that field in a separate database view first, then sharing that view's link, an extra step and the only one of the brief's two links that needed a manual pass.
- Auto-refresh worked exactly as promised: New rows from the source spreadsheet synced into Zite's own database "on its own at least once a day," and I never re-uploaded a file when a deal closed.
- The build used a modest slice of the plan's credits: About 20 credits of the 100 included on Zite's Pro plan, since dragging fields into place and toggling share-link visibility counted as free selective edits. Only the AI-generated parts of the build drew from the credit pool.
The hidden-field view for the partner-facing link lived alongside the main view, in Zite's own view manager.
Key Features
- Linked data sources: An external source syncs into Zite's own database automatically.
- Field-level share links: Hide fields in a view, then share that view's link.
- Filter-based exceptions: Filter a single card without touching the rest of the dataset.
Pros and Cons
Pros:
- Collects and stores data, going beyond visuals alone.
- Handled the canceled-deal exception correctly, first try.
- Auto-refreshed daily, no manual re-upload.
Cons:
- Hiding dollar amounts needed a separate view and a manual pass.
- The AI-generated parts of the build still drew a real chunk of the monthly credit pool.
What Users Say
“Implementation was straightforward - connecting forms to the ERP was much faster than expected, with no custom glue code to maintain afterwards.” - Alvaro H., G2

“It does not sync with GitHub like v0 or lovable” - Rddtusrcm, Reddit

Pricing

Every Zite tier, including Free, comes with unlimited users. The free plan adds limited credits, 5,000 database records, 1,000 workflow runs a month, unlimited apps, and one brand kit.
Its cheapest paid plan, Pro, costs $25/month ($20/month, billed annually) for 100 credits a month and 100,000 database records. Business runs $89/month ($75/month, billed annually) for 200 credits a month and 250,000 database records, adding unlimited custom domains and white-label emails.
Zite's Team bundle, an all-in-one plan for deploying apps, forms, and databases, costs $300/month ($250/month, billed annually) for 800 credits a month and 1,000,000 database records. Enterprise pricing is custom and adds single sign-on, audit logs, and dedicated support.
Bottom Line
The share-link masking took one extra step, the only friction in an otherwise smooth build, a small price for a solo creator who wants this tool to also collect the data.
2. Softr: Best for Turning the Dashboard Into a Portal
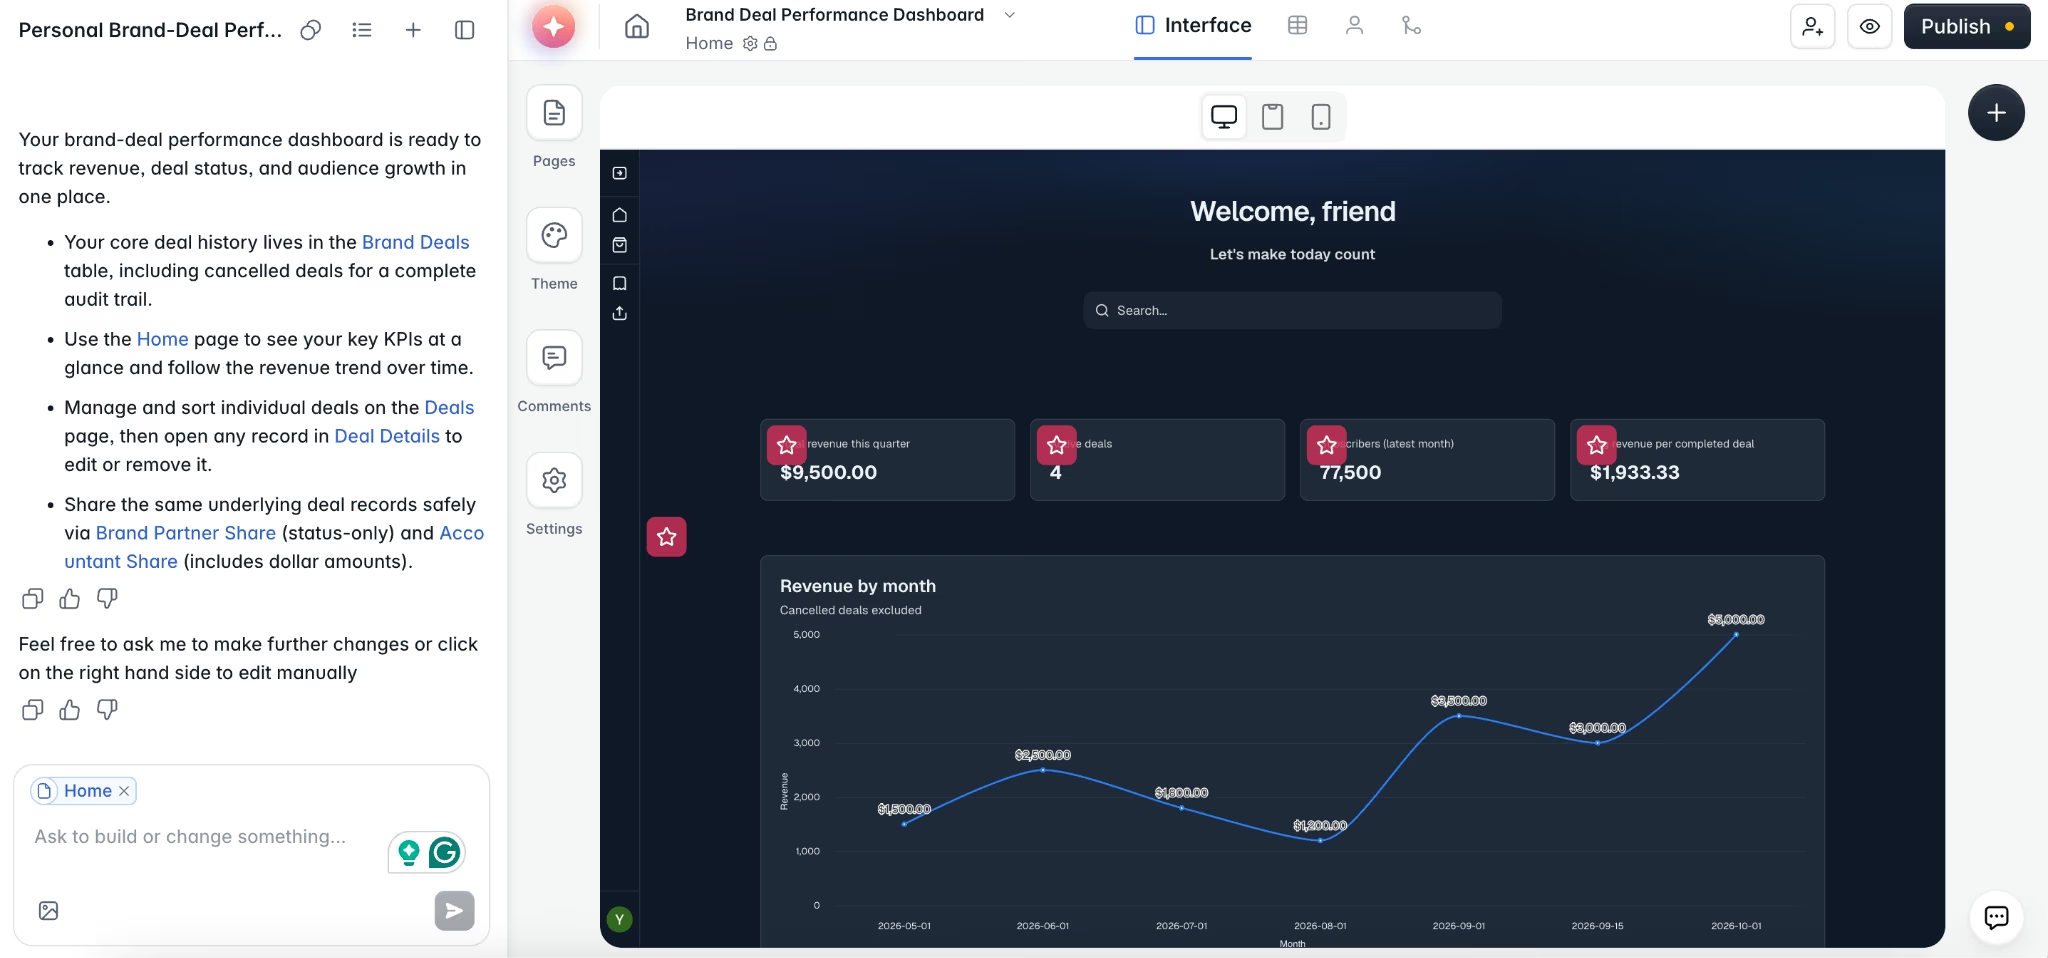
What it does: Softr is a visual, AI-native platform that turns a connected data source into a full web app.
Best for: A creator who wants this dashboard to grow into a portal later.
I built the same two data sources as an Airtable base first, since Airtable is one of the external sources Softr connects to most often, a different starting point than Zite's forms-first approach. Then I used the AI App Builder to generate the dashboard pages from a shorter version of the brief.
The layout came together well on the first pass, all four summary cards and the trend chart in place within minutes of connecting the base. The catch was keeping the trend chart and the summary cards visually consistent afterward.
The rest of the build turned on two things:
- AI edits apply per block: A change to one card doesn't ripple to the rest of the page, so getting one consistent look across the dashboard took a few extra manual passes I hadn't planned for.
- The two-share-link split worked, with a workaround: Softr's custom user groups, a Pro-plan feature, let me build two separate blocks off the same base, one with the dollar-amount column, one without, and gate each by user group, a display-layer workaround.
Softr's own docs still list true per-field restriction as "coming soon," but it produced the split the brief asked for. The whole build took 35 minutes and used 12 AI credits of the Pro plan's 50-credit monthly allotment.
The canceled-deal exclusion rule used the same block-level scoping. A filter condition on the revenue block excluded anything marked canceled, with the deal-list block left on its own unfiltered connection.
I'd point a creator here specifically if this dashboard is a first step toward something bigger, like a client portal, a gated resource, or a members' area. The underlying app model already supports that growth. If all you want is a dashboard and nothing more, that flexibility is more tool than you need right now.
Key Features
- AI App Builder: Describe the pages, get a draft to edit.
- User groups: Different visitors see different views, on the Pro plan and up.
- External data connections: Airtable and 15-plus other outside sources stay live and editable, no separate import step.
Pros and Cons
Pros:
- Solved the two-audience masking the brief needed, even though it's a block-level workaround rather than true field-level restriction
- The app model supports a full portal later.
- The AI App Builder produced a usable layout.
- Keeps the dashboard connected to the source records in Airtable.
Cons:
- AI edits apply only to the selected block, so a consistent look takes manual passes.
- Matching the chart and cards visually took longer than the build itself.
- Custom user groups need the Pro plan; Basic doesn't include them.
What Users Say
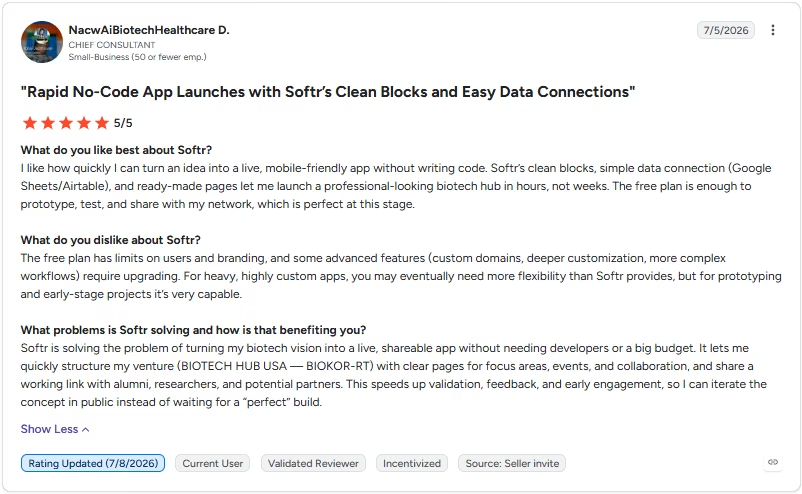
“Softr’s clean blocks, simple data connection (Google Sheets/Airtable), and ready-made pages let me launch a professional-looking biotech hub in hours, not weeks.” - NacwAiBiotechHealthcare D., G2
“The dynamic components, to my knowledge, can't be ‘updated’ directly - you need to collect data from a house, like Google Sheets” - Alex C., G2

Pricing

Softr pricing starts with a free plan that covers five users, 5,000 records, and 5 AI credits a month. Basic runs $25/month ($19/month, billed annually) for 10 AI credits a month, adding a custom domain and conditional form logic.
The custom user groups this build needs sit on the Pro plan, which costs $119/month ($99/month, billed annually) for 500,000 records and 50 AI credits.
Business, the top tier, runs $395/month ($329/month, billed annually) for 100 AI credits a month and adds two-factor authentication, domain-restricted signup, and global data restrictions.
Bottom Line
The block-by-block AI editing meant more manual work than Zite's build needed: Softr took 35 minutes to Zite's 20.
Once the data was in place, though, Softr's user groups (Pro plan) got the two-audience split working, a block-level workaround rather than the true field-level masking Softr's own docs still call "coming soon."
Also read our roundup of the best Softr alternatives to see how eight app builders compare on pricing, limits, and workflow fit.
3. Emergent: Best for One Brief, One Deployed Build

What it does: Emergent's Creator Dashboard Builder turns a written brief into a working, deployable app.
Best for: A creator who'd rather describe the whole dashboard once than wire each piece by hand.

I pasted the full brief in as a single prompt and got a working first version back. It had all four summary cards, the trend chart, and the sortable deal table wired to both data sources. Nineteen minutes in, I already had something close to done.
The one piece that needed a follow-up was the canceled-deal exclusion rule. The first pass excluded canceled deals from both the revenue card and the deal list below it.
The brief only wanted them gone from the revenue number ("total revenue must exclude any deal marked canceled"), while the deal list itself still needed every entry.
One more prompt, telling it to keep canceled deals visible in the table while excluding them only from the revenue total, fixed it. It took a single round of feedback, no restart needed.
Two other results came out of that build:
- The two share links came out automatically: Each pointed at a role, with the dollar-amount field hidden on the partner-facing one. The daily refresh and CSV export ran off the same data model, with no separate setup step.
- Credit cost stayed low for the build itself: The first working version took 12 credits (Pro plan), and the one follow-up prompt to fix the canceled-deal filter added three more, for 15 total. Keeping the app deployed costs an additional 50 credits a month, billed separately from the build.
I matched the generated build against the brief line by line; the real test. The four summary cards matched the brief's four numbers in the same order, and the deal table picked up every field from the brand-deal log with no column-type specification needed.
The follow-up fix took one plain sentence describing the mismatch. The next version came back with the revenue calculation excluding canceled deals and the deal table showing them again, exactly as the brief wanted. The chart and the two share links stayed untouched by the fix.
That precision surprised me a little going into a single-prompt builder, since I'd expected a wrong assumption on one card to mean re-explaining the whole layout.
Key Features
- One-prompt generation: A working build with a data model.
- Iterative fixes: Describe what's wrong. The next pass fixes it.
- Built-in data model: Exports and refresh pull from one place.
Pros and Cons
Pros:
- Generated the full working build in one prompt: cards, chart, table, two links.
- The one mistake was over-excluding canceled deals, fixed with one follow-up.
- Both share links, the daily refresh, and the CSV export all came out of the single build prompt, with nothing extra to configure.
Cons:
- The first pass got the canceled-deal exception wrong before a follow-up corrected it.
- The fix-up prompt still counted against the credit total, and deployment itself carries its own monthly cost.
What Users Say
“It's very easy to instruct the building agents to accomplish your task. I also love having access to Wingman where you can discuss and ideas projects.” - Robert W., G2

“It took a while to understand how best to use at first.” - Max H., G2

Pricing

Emergent uses credit-based pricing, starting with a free plan that includes 10 credits a month and access to its core AI models.
Its cheapest paid tier, Standard, runs $20/month ($17/month, billed annually) for 100 credits a month, adding private project hosting and GitHub integration. Pro costs $200/month ($167/month, billed annually) for 750 credits a month, adding a 1M-token context window and custom AI agents.
Deployed apps cost an extra 50 credits a month, on top of whatever the build itself used.
Bottom Line
Emergent earns its spot on pure build speed, going from one brief to a working dashboard with a single short follow-up to fix the only mistake. Softr still edges it out if a client portal is where this is headed next.
4. Data Studio: Best Free Option, With a Catch

What it does: Data Studio is Google's free tool for turning connected spreadsheets into shareable reports.
Best for: A creator on a zero budget, fine sharing one full view of their numbers.
Data Studio was the easiest tool here to start, straight from an existing Google account into a blank report, no upgrade or credit system required. Both data sources connected as linked sheets in minutes, faster than any other tool in this test got off the ground.
Past the basics, I hit three limitations:
- Chart-level filters need manual setup: Data Studio supports an exclude filter on a single chart, so the canceled-deal rule could be applied to the revenue card without writing an IF formula. Setting that filter still took a manual pass, and the Gemini formula assistant that auto-generates formulas belongs to Data Studio Pro, not the free version tested here.
- Manual layout resizing: Fitting the four summary cards "visible without scrolling on a laptop screen" took three resizing passes before all four sat above the fold without a scrollbar creeping in. The prompt-driven builders handled that step automatically. Data Studio required the manual work every time.
- No per-field masking: Viewer permissions apply to the whole report only, never to individual fields or cards. I couldn't hide dollar amounts on one shared link while showing them on another from the same report.
The only workaround I found was building two separate reports off the same data source. The underlying numbers stayed in sync automatically since both reports pulled from one connection, but I had to build the layout and field visibility by hand, one report at a time.
Two separate reports fall short of the single, per-field-masked dashboard the brief pictured, even though both reports' numbers stayed in sync on their own, a structural limit. The build took 45 minutes total.
Key Features
- Native Google connections: Link Sheets, Ads, and Analytics directly.
- Drag-and-drop report builder: Visual layout, though placement takes adjustment.
- Chart-level filters: Apply logic to one chart without changing the rest of the report.
Pros and Cons
Pros:
- Completely free, both data sources connected in minutes.
- Familiar drag-and-drop layout, no new interface to learn.
Cons:
- Chart filters and layout still need manual configuration on the free tier.
- Viewer permissions cover the whole report only, never one field.
- Four cards needed several resizing passes to fit above the fold.
- Displays numbers pulled from elsewhere but doesn't store any of its own.
What Users Say
“Looker Studio helps create customized dashboards that enable cross-functional teams to extract meaningful insights and identify actionable opportunities.” - Gautam V., G2

“Very confusing to use. Google does not provide enough instruction on how to use their product and it is not intuitive at all.” - Anonymous, G2

Pricing

Data Studio itself is free; no credit system required. A paid Pro tier runs $9/user/project/month, with no annual-billing rate listed.
Bottom Line
Data Studio is the fastest tool here to start, and the cheapest by far. Free wins for a creator testing the idea. Everyone who gets a link sees the same numbers, though, a problem for anyone sharing sensitive figures.
5. Databox: Best for Recurring Reports to a Few Recipients

What it does: Databox pulls connected data into prebuilt templates and automates sending reports.
Best for: A creator sending the same report to a handful of brand partners.
I spent much of my first session in Databox browsing templates, dozens of them. Eventually I found a creator and marketing KPI template close to the brief's shape. Once I picked it, customizing the cards and chart didn't take long. The layout came already polished enough that I barely touched styling.
The canceled-deal exclusion rule worked fine inside one dashboard. The two-share-link split was harder. Edits to the shared template don't automatically apply to a dashboard already built from it.
So the two audience-specific views had to become two separate, hand-built dashboards off the same "monthly brand-deal log."
Once built, though, both dashboards pull live from the same underlying data and update together automatically, so a changed deal amount shows up on both without extra work. The manual part is building and structuring each dashboard's cards up front; the data itself doesn't need re-syncing every time a number changes.
The build also turned up two more things:
- Connection-monitoring alerts: Databox flagged the connection as broken the next time I checked the dashboard after a sync failed (a plus I hadn't expected going in), so a partner-facing report doesn't go stale for long without me noticing.
- The template saved layout time. Metric-mapping still took manual work: The whole build took about 30 minutes, most of it spent in Databox's Metric Builder connecting my own Google Sheet, since a personal spreadsheet doesn't come with pre-built metrics the way Databox's native integrations do, still faster than Data Studio's from-scratch build.
Databox groups templates by category (marketing, sales, ecommerce, SaaS, and more) and by data source, which is why the creator-and-marketing KPI template took filtering to find.
The template supplied a card layout already close to revenue, deal count, and subscriber growth. Connecting my own Google Sheet still meant building each metric by hand first. For each one, I set a value column, a date column, and a data type before I could drop it into the template's cards.
Key Features
- Prebuilt KPI templates: Close to your use case, though finding one takes time.
- Automated recurring reports: Reports send themselves; no manual export.
- Connection-monitoring alerts: Flags a broken source on its next scheduled sync.
Pros and Cons
Pros:
- Once each dashboard was built, its scheduled report kept going out on its own, no re-sending required.
- Connection alerts catch a broken source before a report goes stale for long.
- Prebuilt templates got most of the four-card layout done.
- Handled the canceled-deal exclusion without a hitch.
Cons:
- Template edits don't propagate.
- The right template took a while to find.
- Doesn't mask fields per audience.
What Users Say
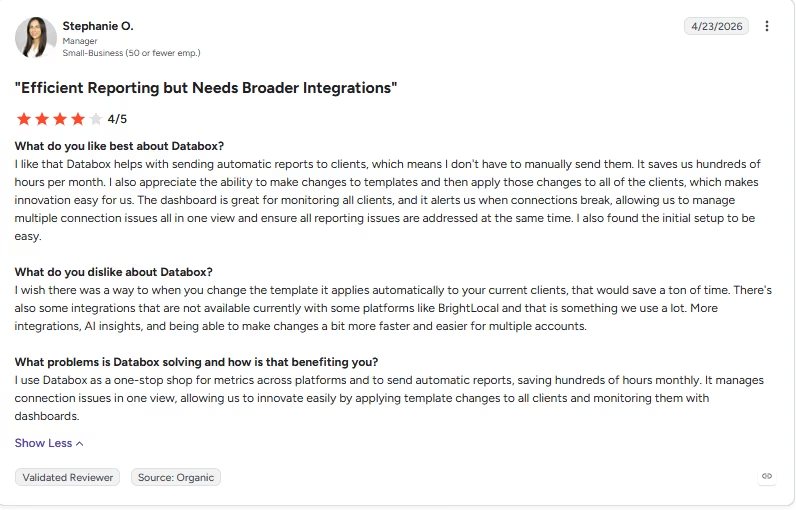
“I like that Databox helps with sending automatic reports to clients, which means I don't have to manually send them.” - Stephanie O., G2
“It is fairly difficult to do custom mapping within the platform. While there are plenty of premade reports, Databox may be pushing more for the added service aspect they offer to build reports for you.” - Trevor H., G2

Pricing
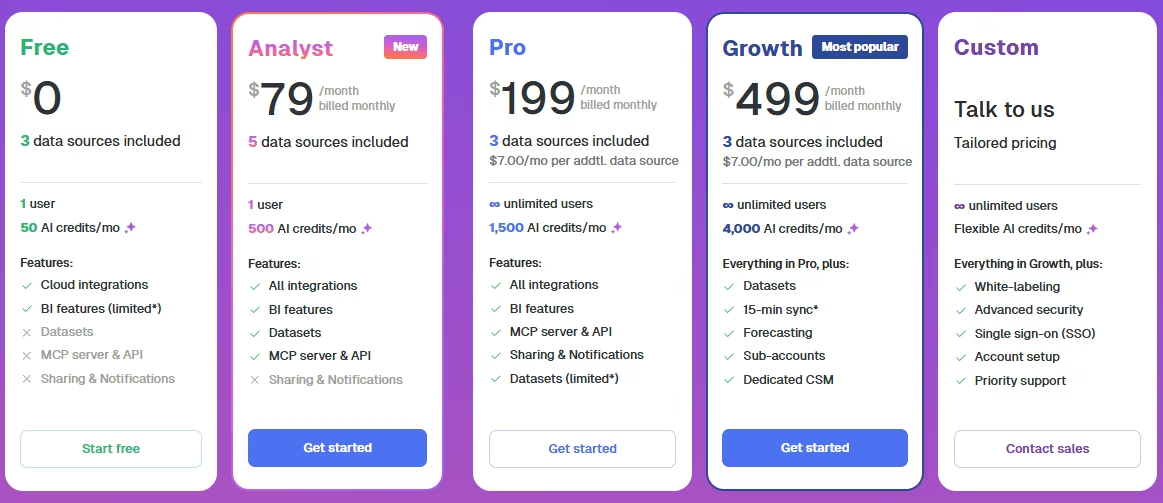
Databox's free Analytics plan includes three data sources and 50 AI credits a month for one user. Analyst, the next tier, runs $79/month ($64/month, billed annually) for five data sources and 500 AI credits a month.
Pro costs $199/month ($159/month, billed annually) for 1,500 AI credits a month and unlimited users. It includes three data sources rather than Analyst's five, with extras at $5.60 per source per month, so Pro's price buys credits and seats, not extra connections.
Above Growth, Databox offers a custom-priced tier for larger teams, plus separate agency reporting plans built for reselling client reports, running $99 to $999 a month depending on client-account and data-source limits.
Bottom Line
Two separate dashboards for one split audience meant real setup work up front, even though the numbers sync automatically once built. Databox fits a creator who wants a recurring report landing in a partner's inbox each month and is willing to build two layouts by hand to get it.
Which Creator Dashboard Tool Should You Choose?
Every tool here can show you numbers. Not every tool can collect them, mask them by audience, or update on its own.
- Choose Zite if you want one tool to collect and display data.
- Choose Softr if this dashboard needs to grow into a portal later.
- Choose Emergent if you'd rather describe the build once than connect each source.
- Choose Data Studio if you want a free start and you're fine with every recipient seeing the identical view.
- Choose Databox if you want the same polished report sent to a handful of partners automatically.
- Skip this category if a platform's own dashboard already covers it.
Final Verdict
Of the five creator dashboard tools I tested, Zite handled the dashboard, canceled-deal rule, refresh, and two-audience requirements, with one manual step needed.
Softr is the stronger call if this needs to grow past a dashboard. Emergent is the fastest way to get a full, working system out of a single prompt, no manual data-source setup first.
How Emergent Helps Creators Build More Than a Dashboard
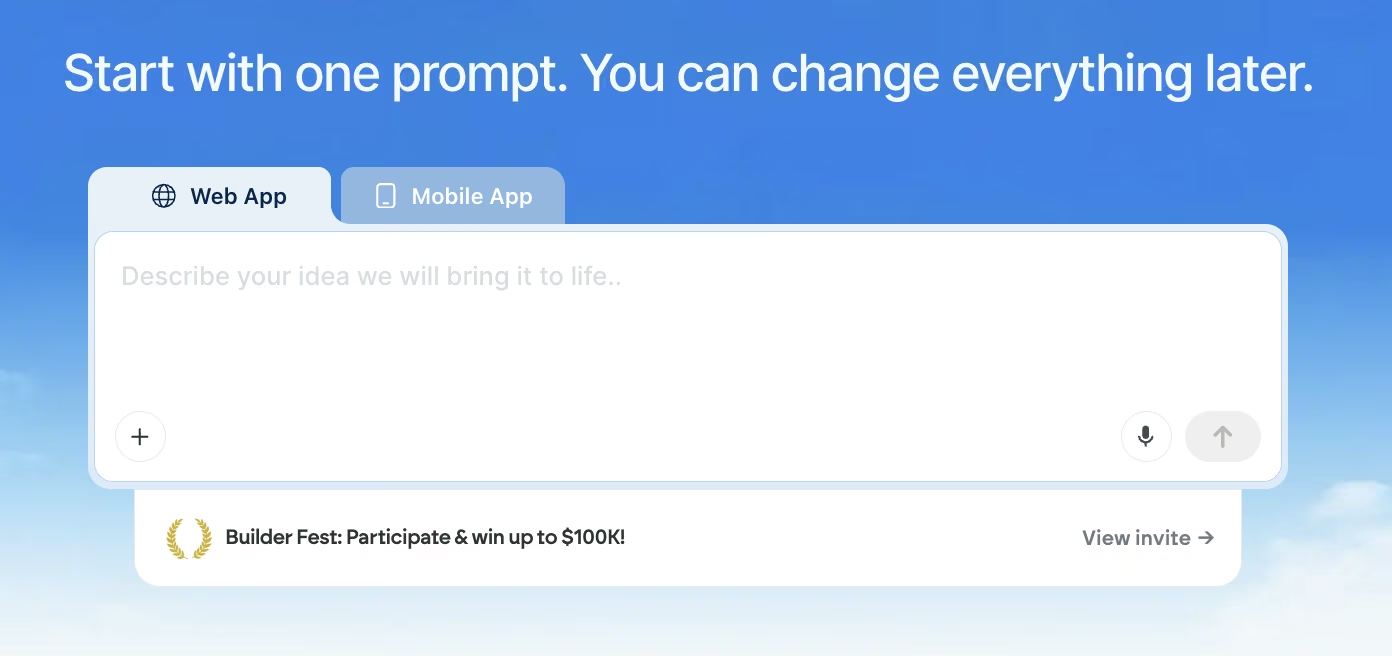
Every tool in this list visualizes or assembles a dashboard. Zite and Softr can even wire up their own status-change workflow triggers separately, a rule that fires an alert once a deal moves from "in progress" to "completed."
Both can also build a connected system around shared data on their own, but in this test, Emergent was the one that generated the whole connected system (the database, the automation, and the dashboard) from one written brief in a single pass.
A dashboard tool alone doesn't close that gap. Emergent creator dashboard builder lets you describe that connected system in ordinary language: a brand-deal tracker with its own database, login, and automations.


Most AI app builders stop at prototypes. Emergent creates production-ready apps you can actually launch.
- Production-ready apps
- Web & mobile apps
- Deploy in minutes