A client dashboard gives customers a single place to check performance, view project progress and access key business information. You can create a client dashboard using a business intelligence (BI) tool, custom code, or an AI app builder, depending on your needs, technical resources, and budget. Keep it simple, cap your costs and remove the hesitation bottleneck.
This guide explains what a client dashboard is, what features it includes and introduces 8 practical examples.
It also contrasts popular build methods, outlines the development steps and offers insight into cost estimation. If you want a custom dashboard but don't want to build all these components from scratch, you can use Emergent to convert a natural-language description into a working application.
What is a Client Dashboard?
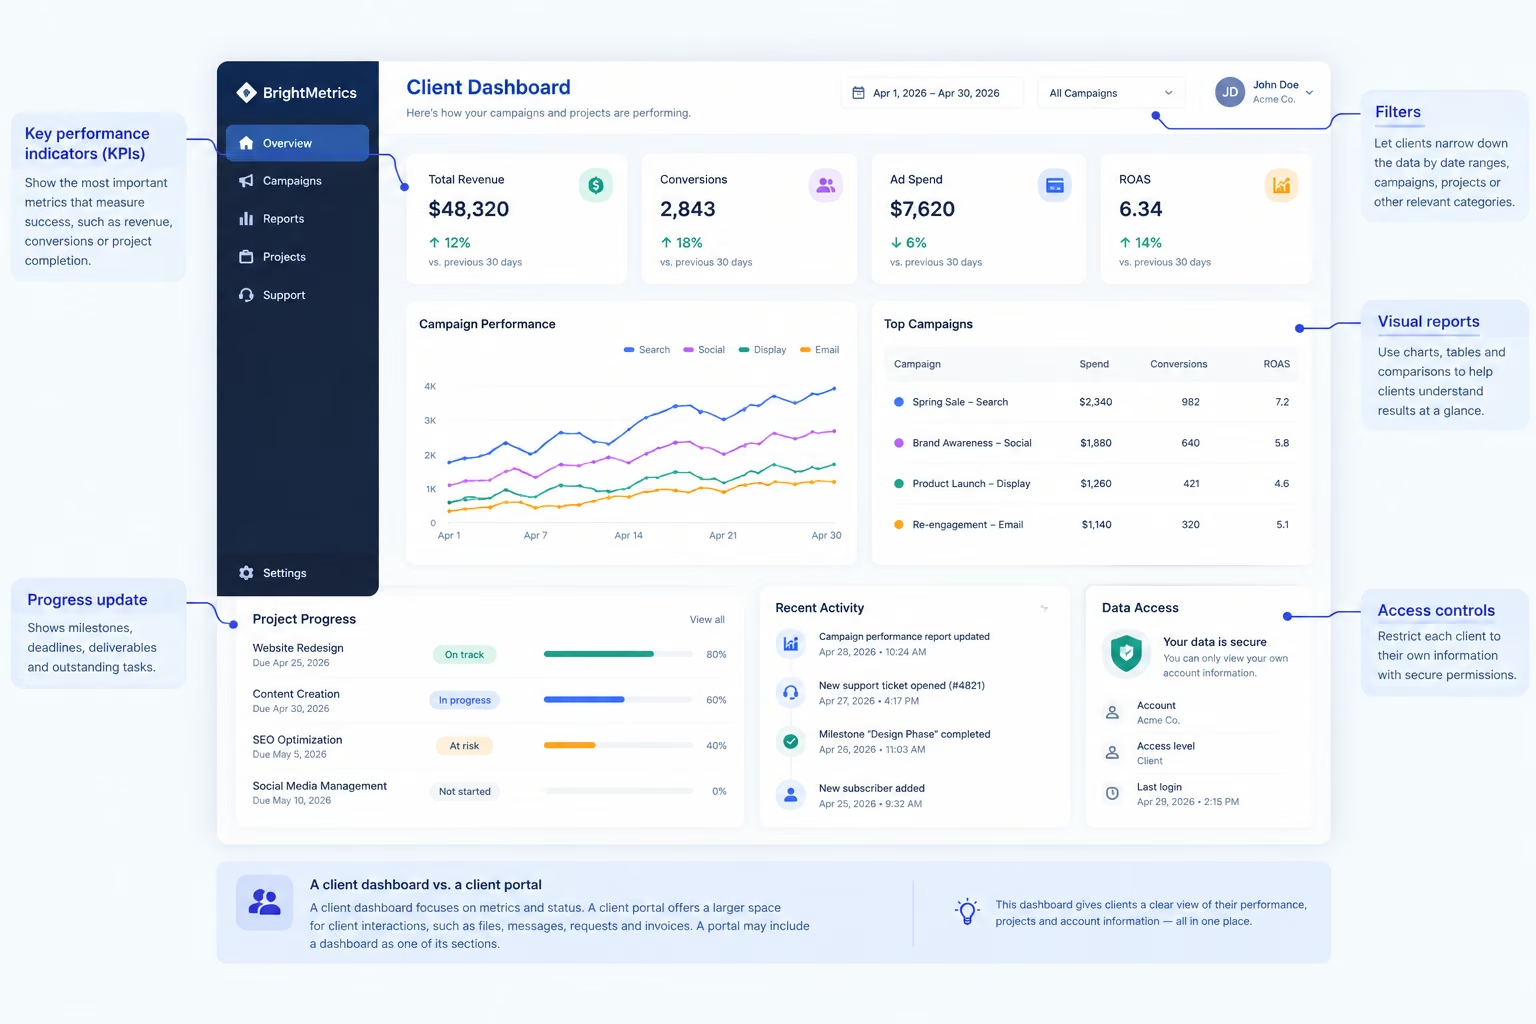
A client dashboard is a web-based solution that gives clients a single place to view information relevant to their client, project, or business relationship.
For instance, a marketing agency can use one to showcase campaign performance, ad spend, conversions and monthly reports. For a software company, it could show the number of subscribers using the software, the number of support tickets opened, and the number of active accounts.
The client dashboard usually features:
- Key performance indicators (KPIs): These are the indicators that are measured as success in a project, like revenue, conversion rate, project completion, etc.
- Visual reports: Charts, tables and comparisons that assist clients to draw inferences from results.
- Progress update: Milestones, deadlines, deliverables and outstanding tasks.
- Filters: Date ranges, campaigns, projects or other relevant categories.
- Access controls: Privileges that limit each client's access to their information.
A client dashboard may be part of a larger client portal, but it serves different purposes.
Why Use Analytics Dashboards?
A client dashboard keeps reporting consistent and gives clients a single window into performance without requiring manual updates each time.
Businesses commonly communicate results using spreadsheets, presentations and email. These approaches can work, but they can create additional reporting problems and make it hard to maintain a single, up-to-date perspective.
A good dashboard will solve these issues in three ways.
- Improve reporting efficiency: Link the dashboard to trusted data sources, and automate refreshes as appropriate. Teams can save time in creating repetitive reports.
- Make performance more easily understood: Place the metrics at the top and give context with comparisons, targets and trends. Clients don't have to interpret multiple files to determine if any results have improved.
- Improve transparency: Show project progress, deliverables, and remaining work. This aids the clients in understanding the product that has been given and what needs to be worked on.
The value of the benefits will depend on data quality, update frequency and the team's consistency in keeping the dashboard updated. Incorrect information or definitions on the dashboard can cause more confusion than clarity.
Client Dashboard Examples: 6 Practical Use Cases
The best client dashboard example solves a client’s specific reporting problem in seconds. Choose a format based on what your client needs to decide or monitor.
1. Marketing Reporting Dashboard
A marketing reporting dashboard integrates campaign data from advertising channels, website analytics and more marketing sources. It lets clients see how they're performing across channels and where their money is going.
For instance, if the client wants to compare paid search and paid social, they can do so by spend, conversions and cost per acquisition. First, determine which platform reports conversions, as some platforms may report them differently.
2. SEO Client Dashboard
An SEO client dashboard monitors organic search over time. It can display data from Google Search Console, analytics data from an analytics tool, keyword ranking data from a supported analytics tool, and organic conversions.
Maintain separate metrics. Conversions, website sessions, and search impressions represent different phases of the customer journey.
3. Client KPI Dashboard
A client KPI dashboard targets just a few business outcomes. A retail client may track things like revenue, average order value, repeat purchases, and conversion rate, among others.
Add a target or previous period comparison if it adds context. An absolute benchmark is unlikely to indicate good or bad performance on its own.
4. Project Status Dashboard
A project status dashboard is a visual control center that aggregates real-time project metrics, task progress, timelines, and resource allocation into a single screen. It indicates progress towards delivery, next steps, project dependencies and pending approvals. It suits software development teams, agencies, and consultants.
For instance, a client might see which tasks are finished, which are pending their feedback, and which are coming up next.
5. SaaS Customer Dashboard
The SaaS dashboard lets customers see account usage, activity, and engagement with the product. It may also include details such as invoices, plan information, support requests, or usage caps, depending on the application.
If the client needs regular access to their own account information, rather than a performance report, use this format.
6. Agency Dashboard
A client's dashboard aggregates multiple client accounts within the agency's internal workspace. Account managers can track campaign performance, deadlines, deliverables, account health, etc.
You can also create an agency dashboard with different views for each client. Unless it is clearly meant to be there, those views should not contain any internal notes, team workload or confidential account information.
How to Build a Client Analytics Dashboard
Decide on the build type that best fits your reporting requirements, customization needs and technical capacity. You don't have to have a full React development workflow for all dashboards, but you need a good way to get, calculate and protect the data.
When the requirement is met by standard reporting, BI tools can be useful. Custom code suits products with specific interface and back-end requirements. An AI app builder can help teams develop a working application by offering prompts and then letting them tweak actions.
Emergent enables custom dashboard creation through natural-language prompts and includes charts, tables, filters, data connections, and application logic.
You can build your own working portal by describing the portal you want, and the domain, hosting, and logins will be helpful. The steps begin as follows:
- Describe Your Requirements: Input a description in English about the objective of your dashboard, the type of users, the data sources and the reports that you require.
- Discuss with Emmy: Emmy, an AI assistant at Emergent, will ask you some follow-up questions and also recommend some useful features for your dashboard, like graphs, filters, tables, etc.
- Create Your Dashboard: With your description entered, Emergent creates an initial draft of the dashboard with all the features as per your requirements.
- Preview of Your Dashboard: Check out the dashboard created, the graphs and the filters used to ensure everything works fine.
- Publish Your Dashboard: Let Emmy include some extra features for you, connect to your client’s data source and publish the dashboard.
According to its official documentation, it supports databases, spreadsheets, datasets, APIs, and webhooks. Integration specifics depend on the source, required authentication, and data flow.
If you are still excited to learn how prompt-giving building works, check out our guide on what an AI dashboard builder is.
What an Analytics Dashboard Needs to Do
A good analytics dashboard helps clients understand performance, explore changes, and find the information they need with minimal effort.
Add these features to your application as needed:
- Display key metrics at the top: Sort the most important metrics to the top.
- Describe change: Use date comparisons, targets or trend lines if appropriate.
- Allow drill-downs: Allow navigation from summary to relevant detail.
- Refresh data reliably: Communicate when data was last updated.
- Secure access to client data: Implement authentication and account permissions.
- Create tables, charts and navigation that work across screen sizes: Make it usable on mobile devices:
- Apply consistent definitions: Compute the same measure the same way from different perspectives.
When designing a practical client dashboard, remember that the focus isn't on decoration, but readability. Compare categories with bar charts, show changes over time with line charts, and use tables when clients need exact values. Don't include visualizations just for the sake of making it look cool.
Steps to Build a Client Dashboard
Use these steps to build a client dashboard that answers real client questions, not just presents data without context.
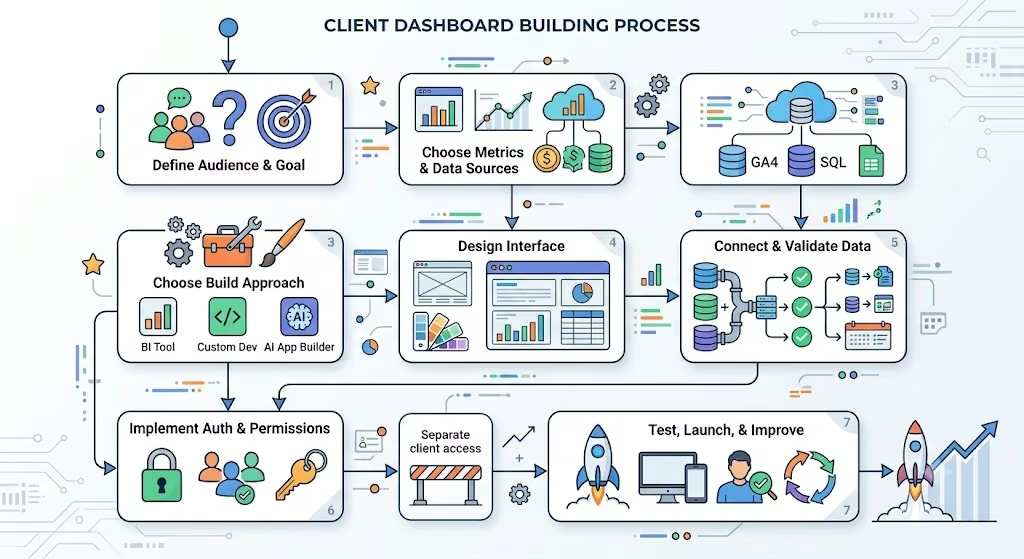
The image shows the end-to-end building process of a client dashboard
Step 1: Define the Audience and Goal
Document users of the dashboard and the types of decisions they will be making. This affects the metrics, permissions and interface.
A marketing client might need campaign results and budget pacing, for instance, while an operations client might need project milestones and unresolved issues.
Stick with the first version and focus on one main goal.
Step 2: Choose the Metrics and Data Sources
Choose a handful of metrics that are directly related to that objective. Describe the definition, source, calculation and refresh time for each metric.
Your data can be stored in PostgreSQL, Supabase, Stripe, Google Analytics 4 (GA4), or spreadsheets. See if the selected build method has the needed connection and permissions.
Revise definitions to cover, for instance, the distinction between gross sales, net sales and recognized revenue before presenting revenue.
Step 3: Choose the Build Approach
Choose a BI tool, custom development or an AI app builder depending on your needs.
For standard charts and reports, start with BI software. If you want a branded client experience and custom workflows, consider custom development or an app builder.
As a starting point for a prompt-based workflow, you might consider using the following specification:
“Create a client dashboard for a digital marketing agency: Include campaign spend, conversions, cost per acquisition, and return on ad spend. Add date filters, trend charts, and a table for each campaign. Make the layout clean and responsive. Require login access and ensure each client can see only their own data. Until the live data connection is set up, use a sample data set with a clearly labeled title.”
Do not treat the first one as a finished production system, but as a starting point.
Step 4: Design the Interface
Organize information in order of importance. List summary metrics first, followed by trends, detailed tables and supporting elements.
Employ consistent labels, legible typography, clearly visible color contrast and clear empty states. Make it clear what will happen if data is not available.
To get a custom client dashboard, match the colors and fonts to your brand, but not at the cost of usability.
Step 5: Connect and Validate the Data
Link the chosen sources and check the results with the original systems. Test date filters, time zones, missing values, duplicate records, and refresh behavior.
If needed, use sample data in early development, but switch to verified live data before presenting the dashboard as an accurate client report.
Step 6: Implement Authentication and Permissions
A client dashboard should not allow one client to get access to another client's information. Don't just hide interface elements; enforce permissions at the server (or data) layer.
Test access using different client accounts. Review direct URLs, API requests, exports or any administrative views that may reveal sensitive data.
Step 7: Test, Launch, and Improve
Test the dashboard on desktop and mobile. Ensure charts are consistent with source data, filters work properly, and errors are readily apparent.
Have some representative users do typical tasks. Take their comments, eliminate confusing elements and prioritize the next features.
What Breaks in Production (and How to Prevent It)
Production issues are rarely attributable to chart styling alone; they usually stem from unreliable data, weak access controls, or unclear metric definitions.
These checks are not supplanted by an AI-generated dashboard. Before using real client data, review the integration, authentication and deployment logic.
What It Costs to Build and Run a Client Dashboard
The overall cost depends on how the build is completed, which data sources are used, user access and hosting and maintenance. Not all clients' dashboards are created equal.
While BI software may be cost-effective for routine reports, per-user license fees or embedded analytics can affect the overall cost. Custom development can provide greater control, but also involve engineering and maintenance expenses.
While AI application builders can reduce manual application execution work, they don't guarantee lower overall costs in every situation. You still need to consider usage, hosting, integrations, testing and constant changes.
Consider total cost of ownership, not just construction cost.
Client Dashboard vs. Client Portal
A client dashboard focuses on metrics and status, while a client portal is more comprehensive and provides more space for client interactions and account services. A portal can include a dashboard.
Use a dashboard when clients are primarily looking to see. When they also need to take action, select an appropriate portal. Both can be used in a custom application.
However, consider one more thing: branding. A white label dashboard can help you achieve that. If you plan to provide the same reporting product to many customers under your own brand, make sure your platform supports custom branding and domains, plus appropriate tenant permissions.
Conclusion
A helpful client dashboard provides clients with the information they need without overwhelming them with reports. Define your audience, limit to a few meaningful KPIs, use trusted data connections, and set access controls. Before scaling the dashboard, test it with real workflows.
Building a facelift from scratch can be time-consuming and require significant engineering effort. If the BI tools seem too restrictive, try Emergent to build a custom client dashboard from a natural-language prompt. Explain your metrics, data sources, layout, and access needs before optimizing and testing the application you produce in front of clients.
Most AI app builders stop at prototypes. Emergent creates production-ready apps you can actually launch.
- Production-ready apps
- Web & mobile apps
- Deploy in minutes