
Dashboard software replaces weekly spreadsheet updates with a single, self-updating visual screen. A sales manager spends two hours every Monday copying CRM numbers into a spreadsheet. A dashboard pulls the same numbers in on its own, and the two hours go away.
By the end, you'll know which of the three dashboard types you need, what it costs, and the point at which a spreadsheet stops being enough.
What Is Dashboard Software? The 30-Second Answer
Dashboard software is a program that connects to your data sources and turns key numbers into charts, tables, and graphs on a single screen, updating automatically as the underlying data changes.
In short, it replaces manual reporting with a live view you can monitor instead of repeatedly rebuilding.
Key Features
Every dashboard tool, regardless of price or industry, is built around the same fundamental features:
- Data connectors: Automatically pull numbers from your spreadsheets, databases, and software, eliminating manual entry.
- Visualization tools: Convert raw data into line charts, bar graphs, and tables, without forcing you to write complex formulas.
- Filters and drill-downs: Allow users to click on a summary metric to inspect the exact rows of data behind it.
- Refresh scheduling: Keeps information up to date automatically, whether that means refreshing every few minutes or once a day.
- Access controls: Manage permissions so the right people see only the data they are authorized to view.
Dashboards generally fall into three categories, and knowing your goal dictates the right tool to buy:
- Operational dashboards: Designed for quick monitoring of live activity, such as a customer support queue or server uptime.
- Analytical dashboards: Built for deep dives into long-term trends, like a marketing team evaluating quarterly campaign performance.
- Strategic dashboards: Display a high-level overview of company-wide KPIs tailored for executives.
How Does Dashboard Software Work?
At its core, every dashboard operates on a continuous pipeline: ingestion, processing, rendering, and scheduling. It links to your existing data sources, filters the raw data into key performance indicators, renders them into charts, and automatically refreshes at set intervals to keep information current.
Here's what that looks like in practice on a dashboard, showing a mix of the chart types most tools default to:
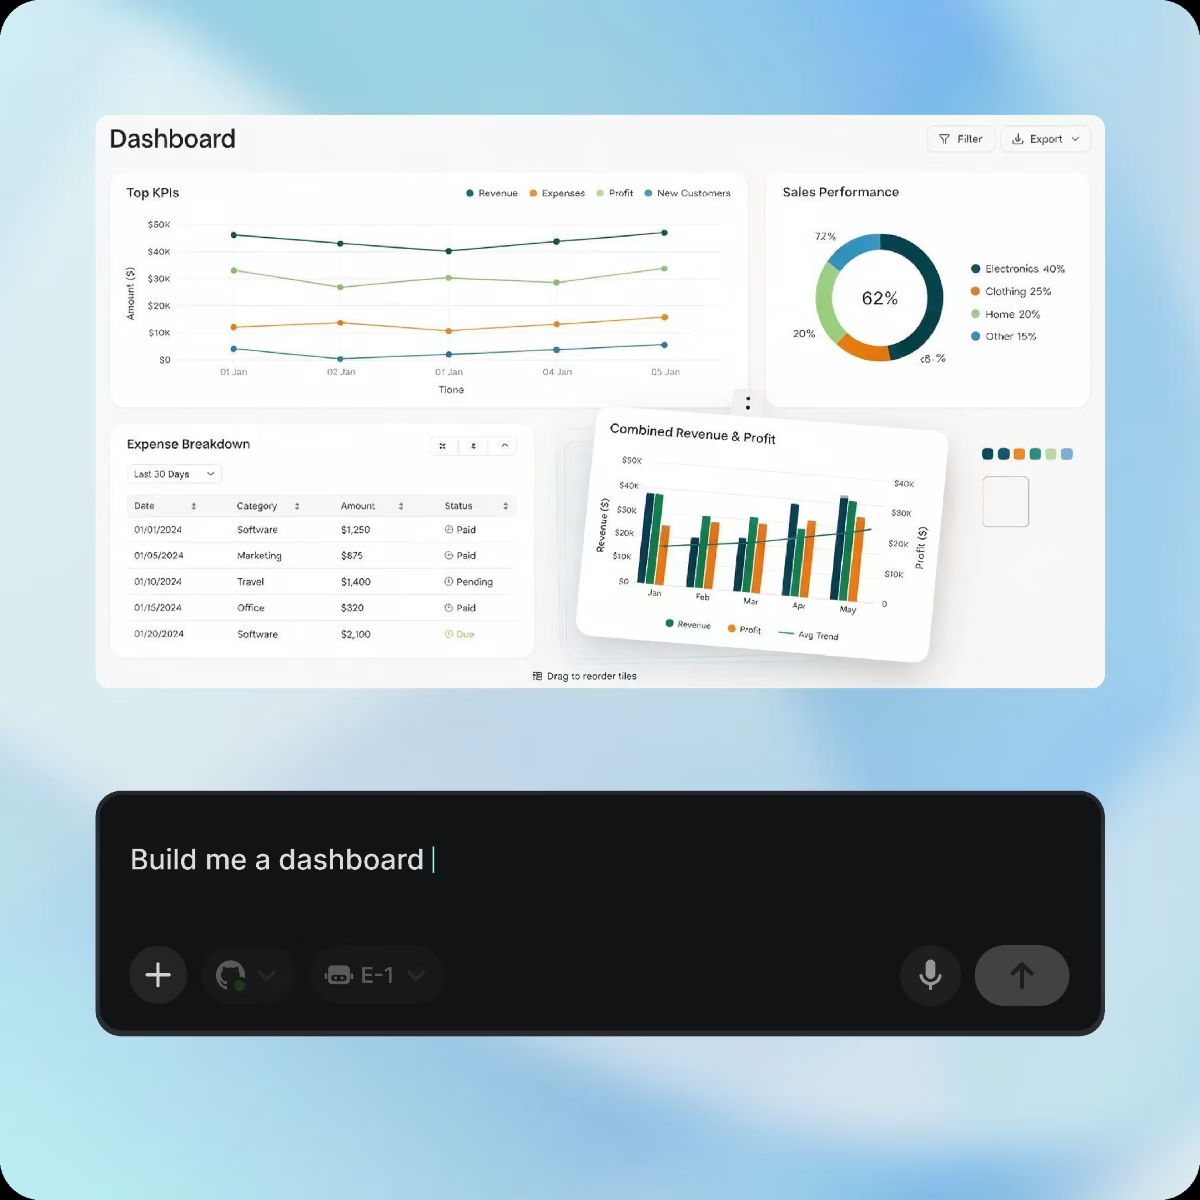
A dashboard combining a KPI line chart, a donut breakdown, a data table, and a combined bar-and-line comparison, the pattern most business dashboards follow regardless of tool.
The example above shows the pattern most business dashboards follow: a top-line KPI chart, a breakdown by category, a detail table underneath, and a combined chart comparing two metrics. Almost every dashboard tool, from the simplest free option to enterprise BI software, uses a version of this same layout.
If you want to specifically learn about dashboards that consolidate key metrics into a single view, our guide on what an analytics dashboard is covers them in depth.
Dashboard Software vs. Spreadsheets: What's the Difference?
Spreadsheets work fine until they don't. You'll know it's time to move on when your team starts arguing over different spreadsheet versions, or manual updates can't keep pace with your data. Remember: spreadsheets are static snapshots, while dashboards are live feeds.
Spreadsheets win for a one-time analysis or a dataset only one person touches. Dashboard software wins the moment the same numbers need to reach more than one person regularly.
If your primary focus is tracking KPIs, our guide on KPI dashboards covers how to select the right metrics.
Pros and Cons of Dashboard Software
Pros (What Works)
- Real-time visibility: A dashboard shows what's happening now instead of what happened as of last week's export.
- Reduced manual reporting: It frees up the hours a team used to spend building the same chart every Monday morning.
- One source of truth: Keep everyone aligned on identical metrics, preventing the confusion of five different spreadsheet versions.
- Quicker decisions: Spot trends the day they start, rather than waiting a month for a report.
Cons (Where It Falls Short)
- Hard to set up: Connecting messy or scattered data takes a significant amount of time.
- Silent data errors: If a connection breaks, the dashboard might quietly show outdated numbers without warning.
- Too much clutter: Cramming too many metrics onto one screen hides the important numbers.
- Technical expertise has a ceiling: Business users can build simple dashboards, but complex ones still need an analyst to build and keep running.
If you're a creator tracking audience and earnings across platforms, our best creator dashboard software guide covers the tools built for that.
Is Dashboard Software Right for Your Business?
Once you spend more time updating numbers by hand than the data is actually worth, it's time for a dashboard. For most businesses, that happens surprisingly early, right around the time a few team members all need to see the same metrics.
Dashboard Software Is a Good Fit If:
- You report regularly: Your team tracks the same metrics daily or weekly, and rebuilding reports manually wastes valuable hours.
- Your data is scattered: Your information lives across multiple tools and currently has to be combined by hand.
- You need shared visibility: More than one person needs to see the same live numbers, which is where messy spreadsheet version conflicts usually begin.
- You are scaling up: Your business is growing and expects to add more metrics or viewers over the coming year.
You Might Not Need It Yet If:
- You're a solo viewer: You only track a few numbers for yourself, and a basic spreadsheet still works without any friction.
- Your metrics rarely change: Your data barely shifts from month to month, meaning "live" updates offer little advantage over a quick monthly check.
- You can't maintain it: You aren't ready to keep your data sources connected and active. A dashboard running on stale data is worse than having no dashboard at all.
If you're used to configuring dashboards manually, our guide on AI dashboard builders breaks down how the prompt-to-build process works.
How to Get Started with Dashboard Software in 5 Steps
Getting your first dashboard live can be faster than you might expect, as long as you follow the right order. The most common reason dashboard projects stall is choosing software before defining what you need the dashboard to do.
- List the five to seven numbers that matter. Pick the metrics tied to a real decision, not everything your tools happen to track.
- Identify where each number currently lives. A CRM, a spreadsheet, an analytics tool, and a payment processor are common sources for even a small business.
- Choose a tool that connects to those sources directly. The right tool is the one that can access your data directly without requiring constant exports and imports.
- Build the simplest version first. One screen with your core metrics beats five screens with everything, especially when you are figuring out what you need.
- Set a refresh schedule and revisit it monthly. If nobody checks the dashboard, it usually means the metrics on it aren't the right ones, not that dashboards don't work for your business.
Dashboard Best Practices Most Guides Skip
Most dashboard advice says to “keep it simple,” but the real issue is cognitive overload. Once a dashboard shows too many metrics at once, people stop reading and start scanning. A practical rule is to keep a single view to five to seven key metrics.
Color choices matter too. About 1 in 12 men have color vision deficiency, so using only red and green to distinguish good from bad can make a dashboard difficult to interpret. Pair colors with another cue, such as an icon, label, or symbol, so the meaning remains clear without relying on color alone.
Mobile access is also important. A dashboard that works on a phone is easier to check regularly than one that requires opening a laptop.
But the biggest problem is often dashboard sprawl: teams create multiple dashboards, then lose track of which ones are still accurate. The solution is to give every dashboard an owner responsible for monitoring its data connections and keeping it up to date.
How Emergent Simplifies Building a Dashboard
Most dashboard software still relies on fixed templates or requires an analyst to build the queries behind each chart. Emergent takes a different approach: describe the metrics and layout you want in plain language, and it builds the connectors, charts, and filters around your description rather than forcing you into a template.
You can connect a database, spreadsheet, or API and get a working first version without a lengthy setup project.
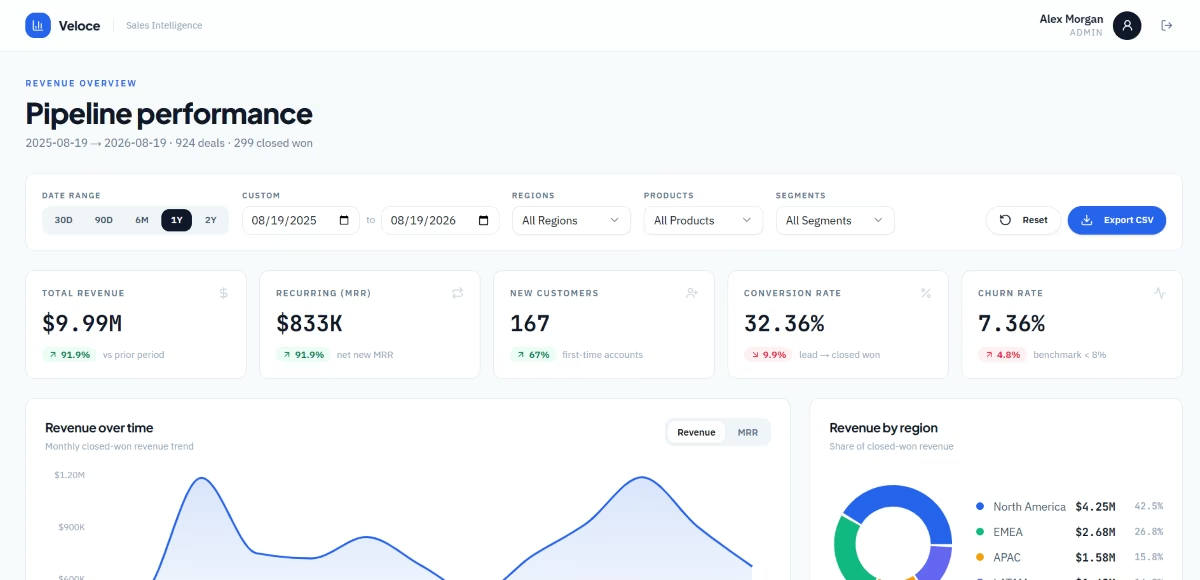
A sample dashboard created using Emergent showing sales performance for Veloce
Here's what that changes in practice: You can change a chart, add a metric, or adjust access permissions by describing what you want instead of sending a request to an analyst. However, there are still trade-offs.
Complex enterprise data warehouses with strict governance requirements are better suited to dedicated BI platforms. For growing teams building their first dashboard, though, being able to turn a description into a working dashboard is a real advantage, and it’s exactly what Emergent's AI dashboard builder lets you do.

Most AI app builders stop at prototypes. Emergent creates production-ready apps you can actually launch.
- Production-ready apps
- Web & mobile apps
- Deploy in minutes