TL;DR
- Emergent: Best for agencies that want a custom dashboard built around how they run projects and clients.
- Lovable: Best for a polished internal dashboard you can build and publish on a free plan.
- Bubble: Best for agencies that want to keep editing their dashboard in a visual editor.
- AgencyAnalytics: Best for marketing agencies that need white-label client reporting across multiple channels.
- DashThis: Best for small agencies that want simple client reporting, charged per dashboard rather than per client.
- Agency Dashboard: Best for agencies focused on search engine optimization (SEO) that want rank tracking and client reports in one plan.
- Data Studio: Best for agencies that report mostly on Google data and want a free option.
An agency dashboard should show how your clients' results are trending and whether any of your own projects are behind schedule. Most tools in this category were built for client reporting, and only a few track the work going on inside your agency.
Emergent publishes this blog, so you'll see our own tool on the list below. I gave the same prompt to three AI app builders: Emergent, Lovable, and Bubble. For the four reporting platforms, I also took a free trial of AgencyAnalytics and read the feature pages, support articles, pricing, and customer reviews for DashThis, Agency Dashboard, and Data Studio.
By the end, you'll know which metrics you need on your dashboard, which tools handle client reporting from the outset, and when a custom build beats a ready-made reporting tool. I'll cover what each one did well and where it fell short, Emergent included.
What to Track on an Agency Dashboard
Most agency dashboards cover two areas: the results you report to clients and the work your team has in progress. Each metric below acts as a key performance indicator (KPI) for one of those areas. Our guide to building a KPI dashboard explains how to choose between them and lay them out.
Client Results
- Traffic and conversions: Sessions, leads, and sales from Google Analytics 4 (GA4) show whether a client's website is turning visits into business.
- Cost per lead and return on ad spend (ROAS): These two numbers tell a client whether their paid campaigns make money, which is usually their first question.
- Search visibility: Rankings, clicks, and impressions from Google Search Console track progress for SEO clients.
- Goal progress: A monthly target for each client, plus a clear view of how close they are to hitting it.
Agency Operations
- Project status: Task counts by stage for each client project help you spot a stalled project before the client does.
- Overdue work: A flag on any project with a task past its due date gives you a daily list of what to chase.
- Team workload: Tasks per person show who's overloaded and who has capacity for new work.
- Retainer usage: Hours or budget against each retainer let you catch an overrun before you send the invoice.
Reporting tools like AgencyAnalytics and DashThis concentrate on client results. A custom build covers agency operations too, and you can add client metrics once you connect the data sources yourself. To automate the reporting itself, our list of agency AI tools covers what marketing teams use most.
How I Picked These Agency Dashboard Tools
I picked tools an agency could realistically run a dashboard on, either by building one or subscribing to one. That gave me three app builders and four reporting platforms. I also looked at Whatagraph and Looker and cut them.
Whatagraph's credit-based pricing leaves only 5 source credits on its free plan, and Looker is Google's enterprise BI platform, priced by quote for data teams.
This is the prompt I gave to the three app builders:
Build a project management app for a small creative agency. Team members sign in with email. Each project has a board with three columns: To Do, In Progress, and Done. Tasks have a title, an assignee, a due date, and a status, and can be dragged between columns.
Add a dashboard that lists every project with a count of tasks by status, and flags any project that has a task past its due date. Seed it with four team members, three realistic projects, and twelve tasks spread across the columns, two of them overdue.
The overdue flag was the real test, as each builder had to work out which projects contained the late tasks and flag only those. I judged all seven against the same five criteria, four of them hands-on and three from their documentation and reviews:
- Live data: Whether the numbers on the dashboard come from real data rather than fixed values.
- Client reporting: How easily you can share results with clients through links, scheduled emails, portable document format (PDF) files, and your own branding.
- Fit to your workflow: How closely the dashboard can match the way your agency runs its projects and clients.
- Setup effort: How long it takes to go from sign-up to a dashboard you'd share with your team or a client.
- Pricing as you grow: How the cost changes as you add clients, dashboards, or users.
7 Best Agency Dashboard Tools: Quick Comparison
Here's how the seven tools compare:
| Tool | Best For | Standout | Free Plan? | Starting Price | Limitation |
|---|---|---|---|---|---|
| Emergent | Custom agency dashboards | Built around your workflow | Limited | $20/month | No reporting templates |
| Lovable | Quick internal dashboards | Polished interface fast | Yes | $25/month | Credits go fast on fixes |
| Bubble | Hands-on editing | Visual editor and database | Limited | $69/month (Web & Mobile) | Paid plan to deploy |
| AgencyAnalytics | Multi-channel client reporting | KPIs, alerts, white label | 14-day trial | $25/client/month | Cost grows per client |
| DashThis | Simple client dashboards | White label on every plan | 14-day trial | $54/month | Source limits per plan |
| Agency Dashboard | SEO agencies | Rank tracking plus reports | 14-day trial | $5/month | Few independent reviews |
| Data Studio | Google-heavy reporting | Free Google connectors | Yes | Free | Paid non-Google connectors |
The first three tools are app builders you can use to build your own dashboard. The last four handle client reporting out of the box. Within each group, they're ordered by the situation they’re best suited for.
Emergent: Best for a Custom Dashboard Built Around Your Agency
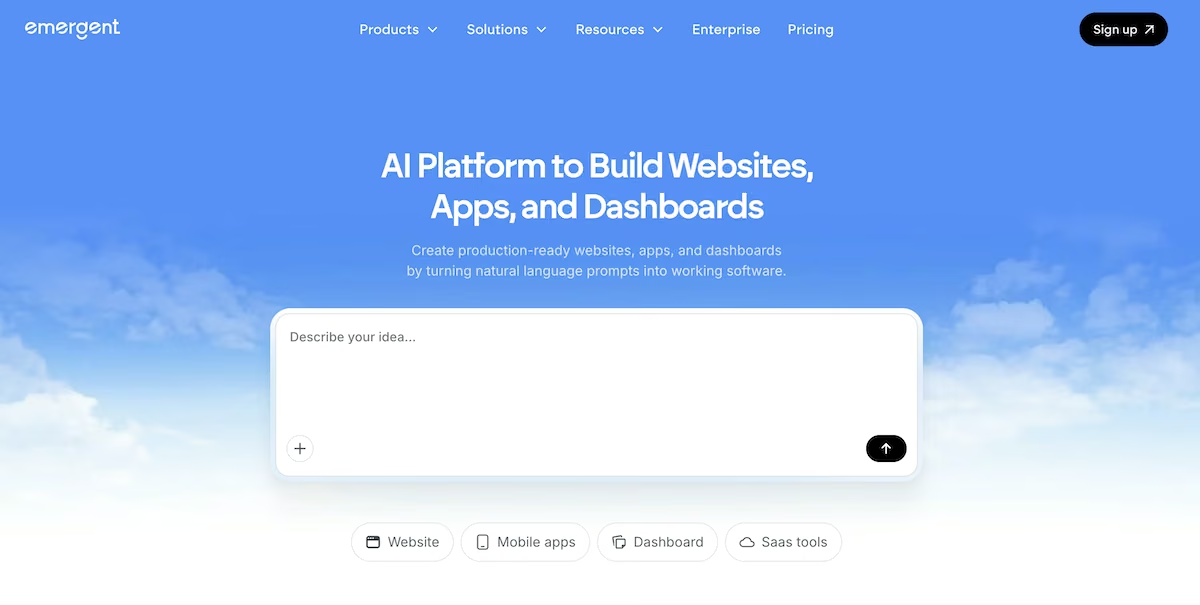
What it does: Emergent is a vibe coding platform that turns a written description into an app with sign-in, a database, and hosting, then tests the result before you see it.
Best for: Agencies that want a dashboard built around their own projects, clients, and rules, and that want to own the code behind it.
I built mine with Emergent's AI dashboard builder. Emergent asked me one question before it started: whether I wanted a web app, a mobile app, or a landing page. Once I chose a web app, its agents split up the work. Some designed the interface, others set up sign-in and the database, and testing agents checked the build before Emergent reported back.
Along the way, it wrote a product requirements document into the project and saved test sign-in details so I could log in straight away. The build took 13 minutes.
The dashboard matched the brief. It showed four team members, three projects, and 12 tasks, and it flagged Kestrel Coffee Rebrand and Solstice App Launch as overdue while marking Meridian Editorial Vol. 03 as on track. A "Projects needing attention" banner named both flagged projects above the project cards, and each card showed its task counts by stage.

The only flaw I found was minor. The dashboard greeted me with "Morning, Ava" in the evening.
The cost caused more of a problem. The build used 15.19 credits, which is more than the 10 credits a month on Emergent's free plan.
The Standard plan includes 100 credits a month, and keeping an app live uses 50 credits a month, according to Emergent's deployment guide. That leaves 50 credits, and this build would have used 15.19 of them.
During the build, Emergent also noted that I kept full ownership of my idea, content, and any intellectual property (IP) in the app.

My build tracked projects, not client marketing results, and it used sample data. If you need client metrics too, you'd build those screens and connect the data sources yourself.
Key Features
- Specialized agents: Different agents design, build, and test your app, so testing agents catch problems before you open the preview.
- Built-in hosting: Apps go live on Emergent's managed hosting at an emergent.host address, and you can add a custom domain.
- Code you can export: The GitHub integration on Standard and above lets you keep a copy of your code and continue working on it elsewhere.
Pros and Cons
Pros:
- You can build a dashboard around your own rules, such as overdue flags or retainer limits, instead of choosing from a template's metrics.
- Testing agents review the app before you see it, which cuts down the fixes you have to request.
- You keep ownership of what you build, and you can export the code.
Cons:
- Credits go quickly on larger builds, and a live app uses 50 credits a month in addition to what you spend on changes.
- It offers no ready-made client reporting templates, so you start from a description rather than a finished report.
- Its PDF generation still falls short, so avoid it if your clients expect detailed PDF reports every month.
What Users Say
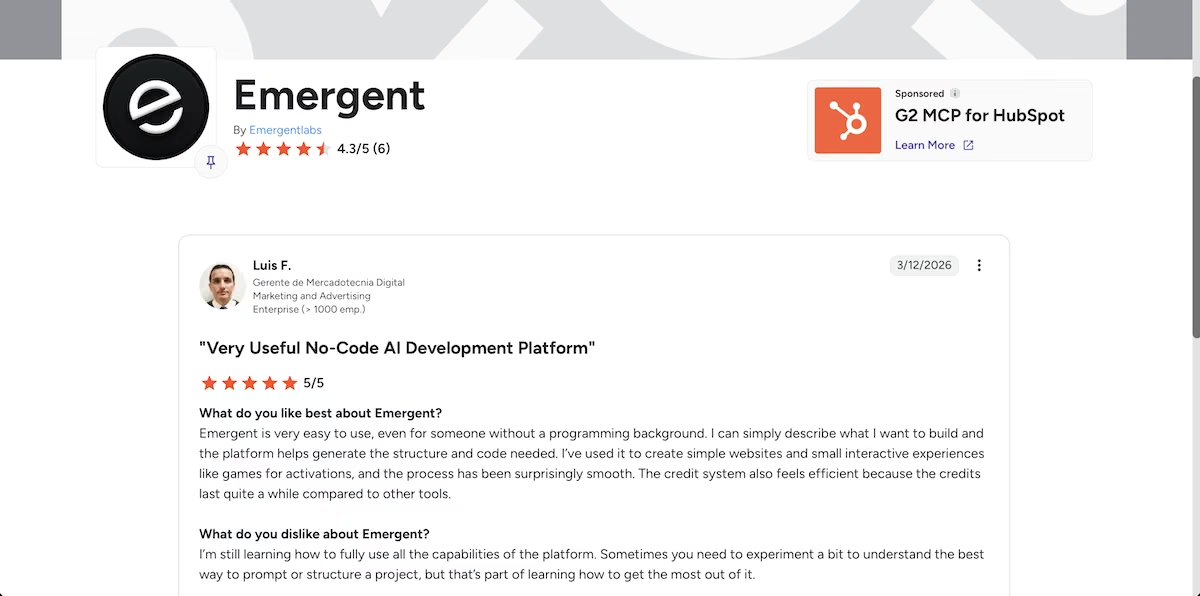
“Emergent is very easy to use, even for someone without a programming background.” - Luis F. (G2)
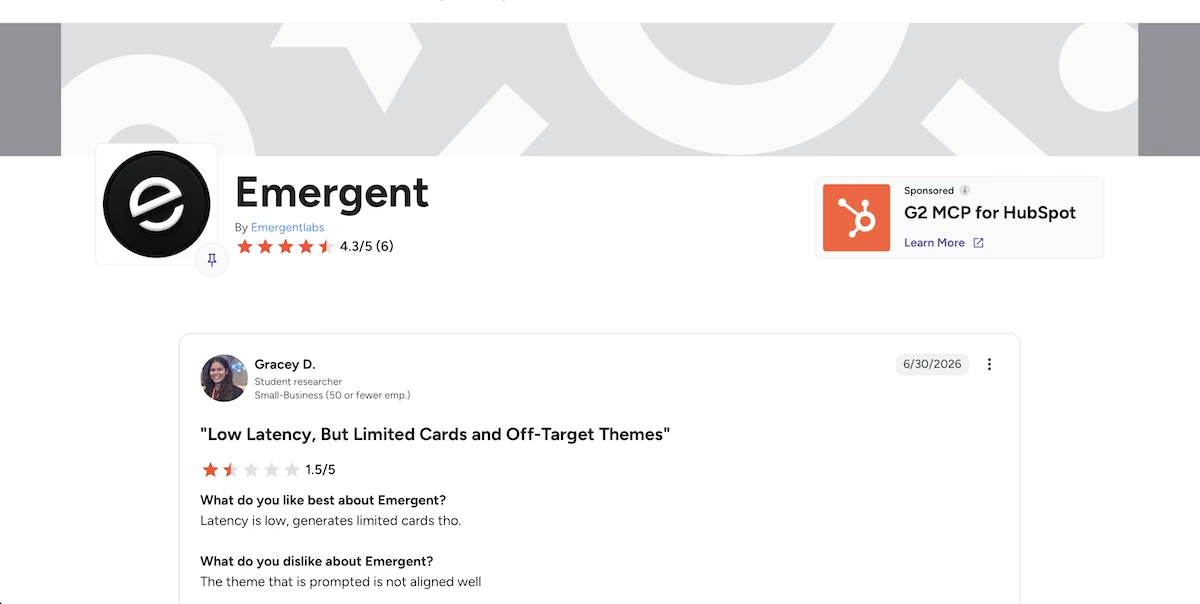
“The theme that is prompted is not aligned well” - Gracey D. (G2)
Pricing

Emergent's Free plan includes 10 credits a month. Standard costs $20/month, with 100 credits, private project hosting, and the GitHub integration. Pro costs $200/month and includes 750 credits, a 1M context window, and custom AI agents. Both paid plans have an annual option, and each deployed app uses 50 credits a month.
Bottom Line
I'd recommend Emergent to agencies that want a dashboard built around their own projects and rules, and that are happy to budget credits for building and hosting. If your clients mainly want polished monthly PDF reports, a reporting tool like AgencyAnalytics or DashThis is a better fit.
Lovable: Best for a Polished Internal Dashboard on a Free Plan
What it does: Lovable turns a written prompt into a web app with a designed interface, sign-in, and a database, and it lets you publish the app to a lovable.app address.
Best for: Small teams that want a good-looking internal tool quickly and can work within a daily credit limit.
Lovable started building as soon as I sent the prompt. About 5 minutes later, it reported a clean build and listed the two projects it had flagged as overdue.
I couldn't check that straight away, because sign-up didn't work. I filled in the form and clicked the button, and the page didn't respond or show an error. I asked Lovable to fix sign-up and to turn off email confirmation, so a new account could sign in immediately.

Its first fix changed the sign-in settings but didn't solve the problem. On the second attempt, it found the real cause: my password had appeared in a known data breach, and the form had rejected it without saying why. The security check was sensible, but a clear error message would have saved two rounds of fixes.
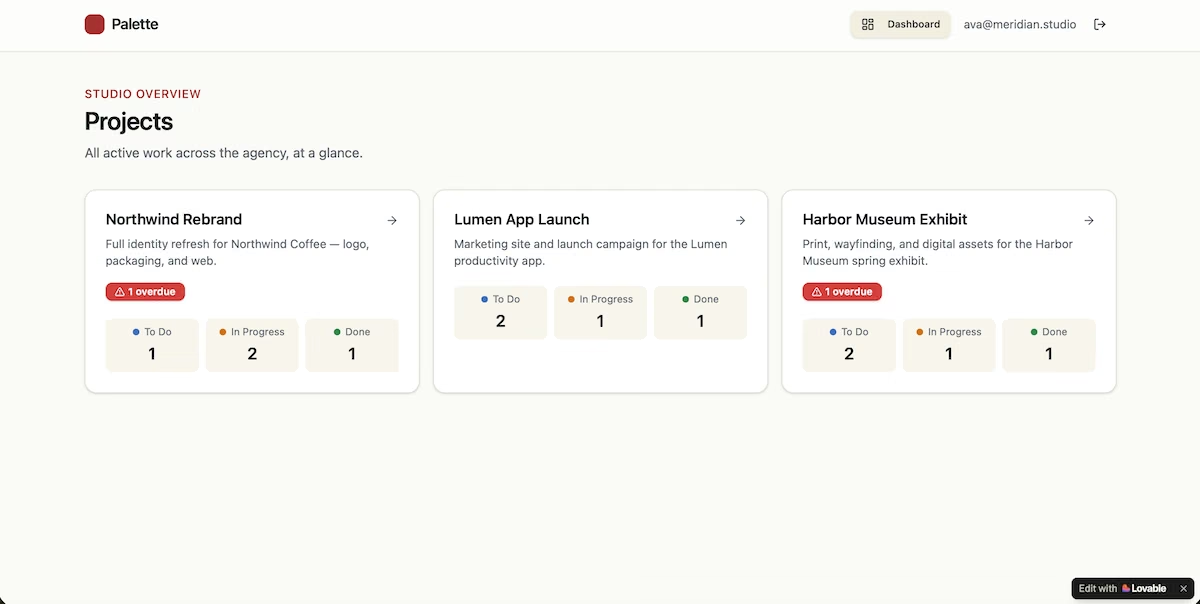
Once I'd signed in, the app matched the brief. Lovable had named it Palette, and its dashboard listed all three projects with task counts by column and 12 tasks in total. It flagged Northwind Rebrand and Harbor Museum Exhibit as overdue and showed Lumen App Launch as on track.
The fixes cost more than the build itself. By the time I could see the dashboard, Lovable's counter showed zero free credits left for the day, so any further changes had to wait until the next day.
Running out didn't stop me from publishing, though. Lovable's publishing docs say publishing from the Publish dialog is free even with a zero credit balance, and I published Palette to a lovable.app address from there.
Key Features
- Prompt-to-app builds: You describe the app, and Lovable builds the interface, sign-in, and database in minutes.
- Free publishing: Every plan, including Free, can publish to a lovable.app address, and custom domains come with paid plans.
- GitHub sync: You can connect a GitHub repository and keep a copy of your code outside Lovable.
Pros and Cons
Pros:
- Builds are fast, and the interfaces look finished without any design work.
- The free plan lets you build and publish, so you can try it properly before paying.
- GitHub sync means you aren't locked into the platform.
Cons:
- Daily credits run out quickly when the AI has to fix its own mistakes.
- Vague error messages can make problems harder to diagnose.
- It doesn't include client reporting features like scheduled reports or white-label sharing.
What Users Say
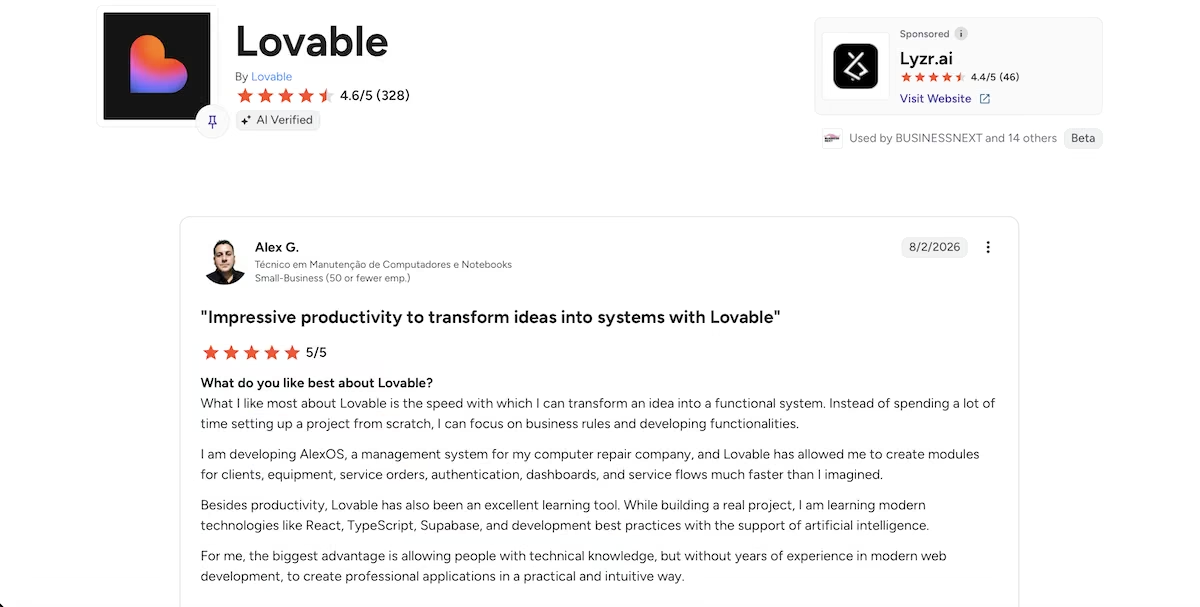
“What I like most about Lovable is the speed with which I can transform an idea into a functional system.” - Alex G. (G2)
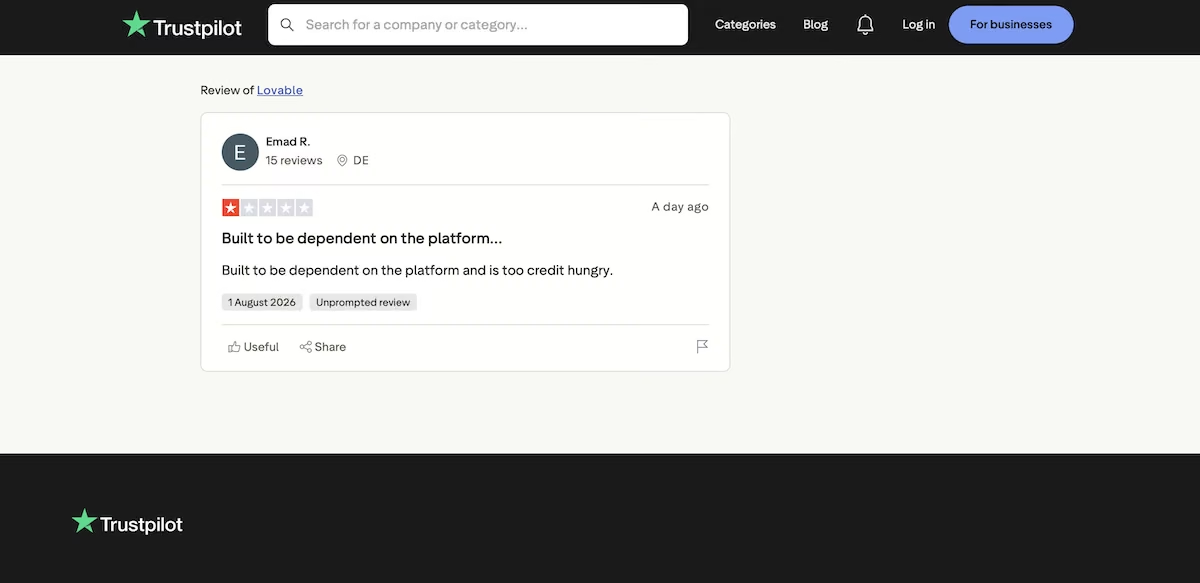
“Built to be dependent on the platform and is too credit hungry.” - Emad R. (Trustpilot)
Pricing
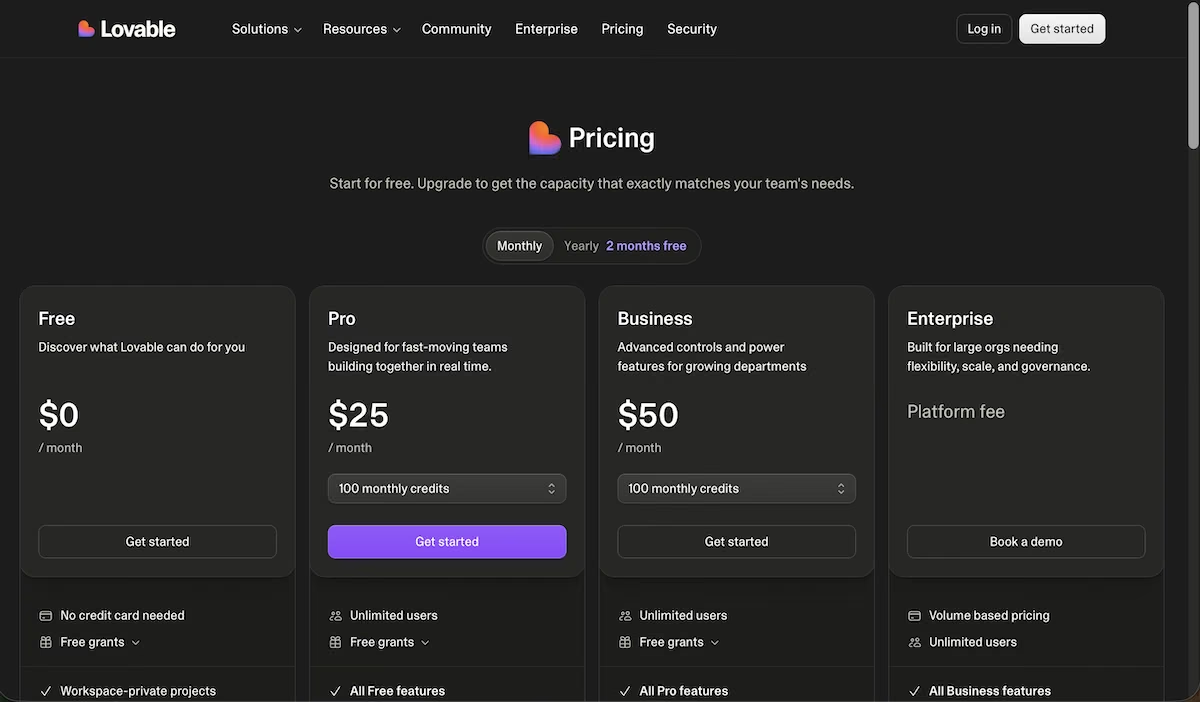
Lovable's free plan gives you 5 build credits a day, up to 30 a month, and 20 Cloud credits a month for hosting. Pro costs $25/month for 100 credits and unlimited users, and Business costs $50/month with added controls for larger teams. Enterprise is priced on a platform fee. Paying yearly gives you two months free.
Bottom Line
Lovable suits a small team that wants a sharp-looking internal dashboard quickly and doesn't mind waiting for credits to reset. Test sign-up and every screen yourself before sharing it, since its build summary won't catch everything.
Bubble: Best for Editing Your Dashboard by Hand
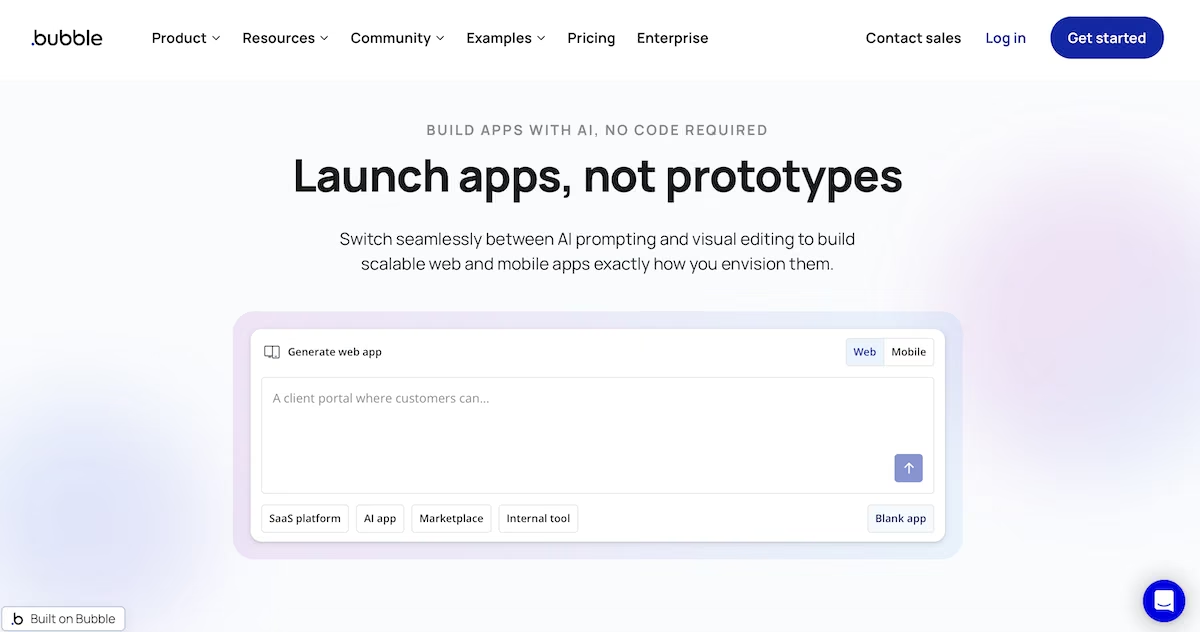
What it does: Bubble generates an app from a prompt, then opens it in a visual editor where you can change the design, database, and workflows without code.
Best for: Teams that expect to keep adjusting their dashboard long after the first build and are willing to learn a visual editor.
Only Bubble turned my prompt into a written plan before it built anything. The plan named each part of the app, including a feature called Overdue Task Flagging, so I could see it had understood the rule before it started. It also named the app Agency Flow.
Bubble built the app in 6 minutes, but it interrupted me twice along the way: once to ask how I'd heard about Bubble, and once to offer a 14-day trial of its premium features.
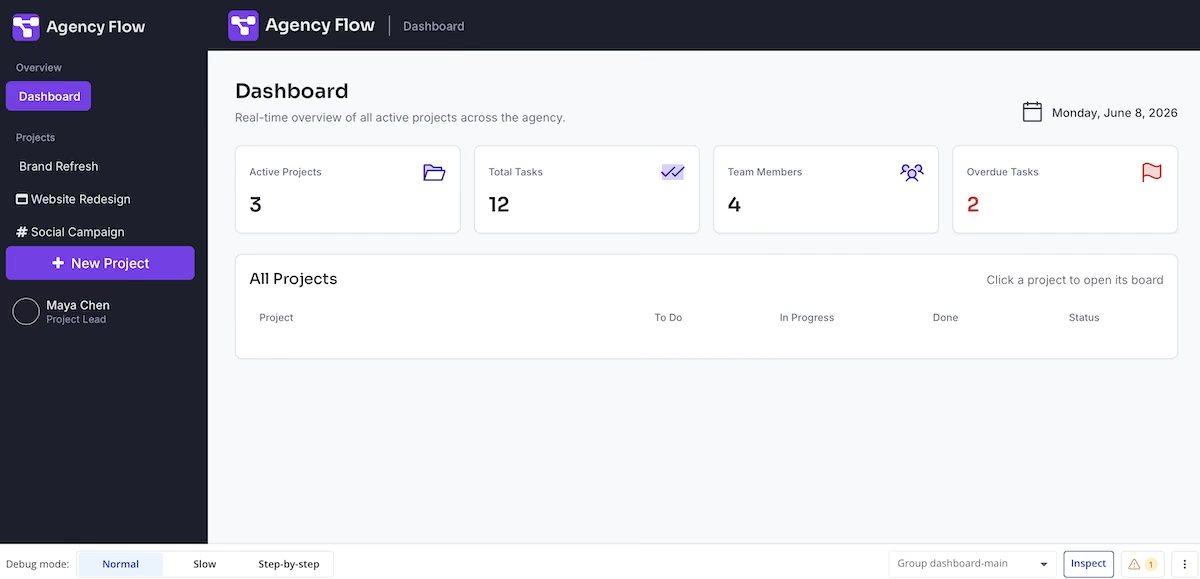
When the build finished, Bubble opened its editor. The dashboard had four stat cards showing three active projects, 12 total tasks, four team members, and two overdue tasks, under a subtitle that called it a real-time overview of the agency's projects.

The preview told a different story. The All Projects table was empty, and when I opened the Brand Refresh board, all three columns showed zero tasks. The stat cards were fixed numbers above an empty database, so the overdue count didn't come from any real task.
The editor also listed three issues, and the dashboard displayed a date that was over a month before my build.
Fixed numbers on a dashboard cause real damage, so I'd check each figure against the database before relying on it. Bubble's free plan let me build and preview, but an Upgrade to Deploy button in the editor meant publishing would need a paid plan.
Key Features
- AI app generation: Bubble turns a prompt into a plan and a first version of your app, which you can then edit.
- Visual editor: You change layouts, data, and workflows by clicking and configuring, with no code to write.
- Plugin marketplace: Plugins add payments, charts, and other services without custom development.
Pros and Cons
Pros:
- You can change almost any part of the app after the AI finishes.
- The design, database, and workflows are all in one platform.
- A large community and plenty of tutorials help when you get stuck.
Cons:
- The learning curve is steep, especially for workflows and database design.
- You need a paid plan to deploy your app.
- AI-generated screens can show placeholder values, so you have to confirm each figure against the database.
What Users Say
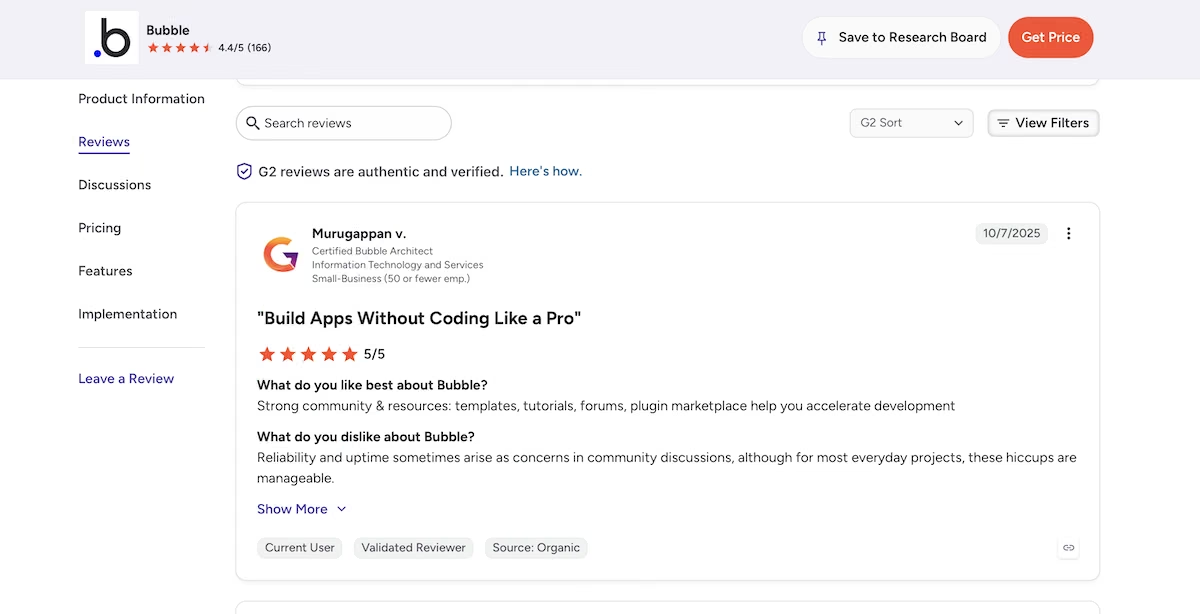
“Strong community & resources: templates, tutorials, forums, plugin marketplace help you accelerate development” - Murugappan v. (G2)
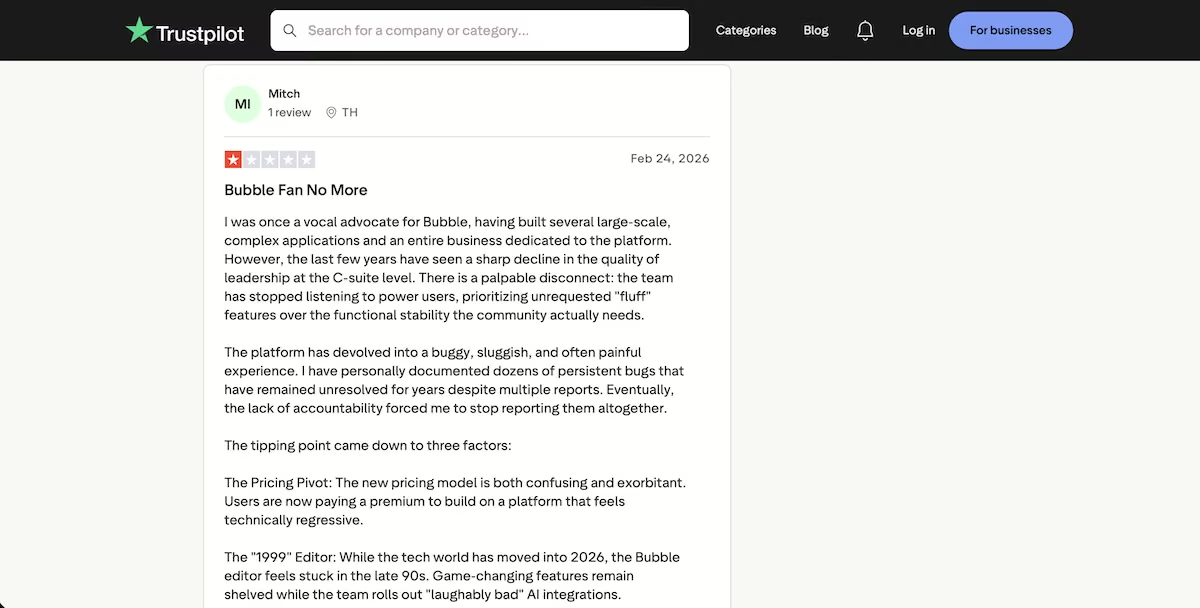
“I was once a vocal advocate for Bubble, having built several large-scale, complex applications and an entire business dedicated to the platform. However, the last few years have seen a sharp decline in the quality of leadership at the C-suite level.” - Mitch (Trustpilot)
Pricing
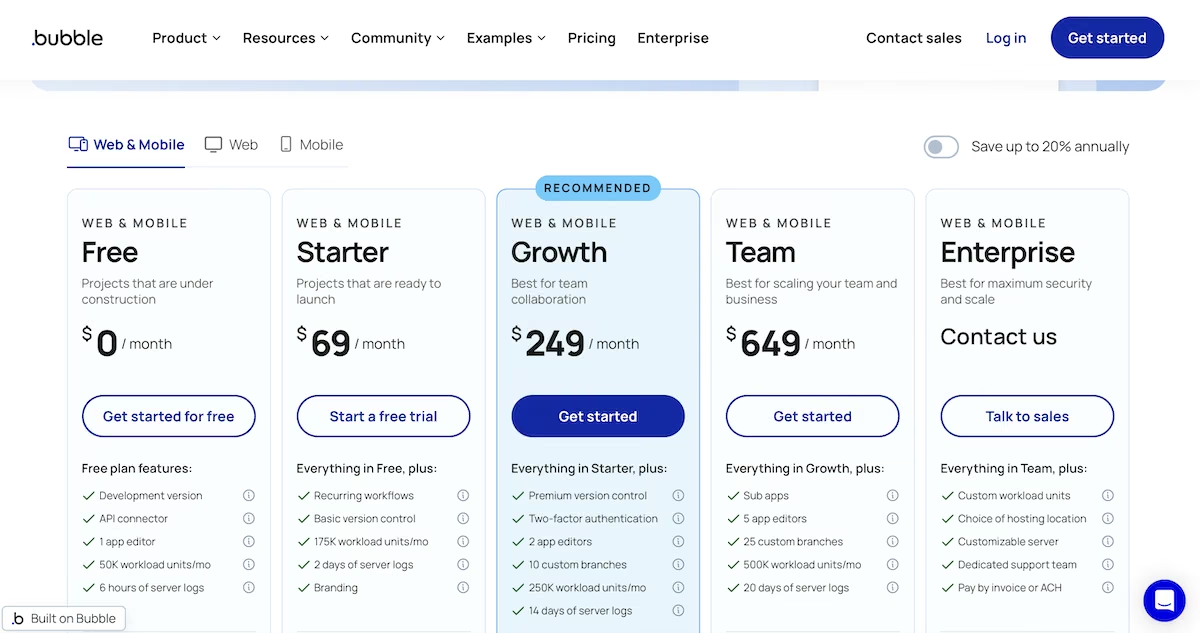
Bubble's free plan for projects still in development covers one app editor, 50K workload units a month, and six hours of server logs. Starter (Web & Mobile) costs $69/month and adds recurring workflows and 175K workload units. Growth costs $249/month, Team costs $649/month, and Enterprise pricing is available by quote. Annual billing saves up to 20%.
Bottom Line
I'd point agencies toward Bubble if someone on the team wants to own the dashboard and keep refining it in a visual editor. If you want something accurate from the first prompt with little manual work, one of the other builders is a better starting point.
AgencyAnalytics: Best for White-Label Client Reporting Across Channels
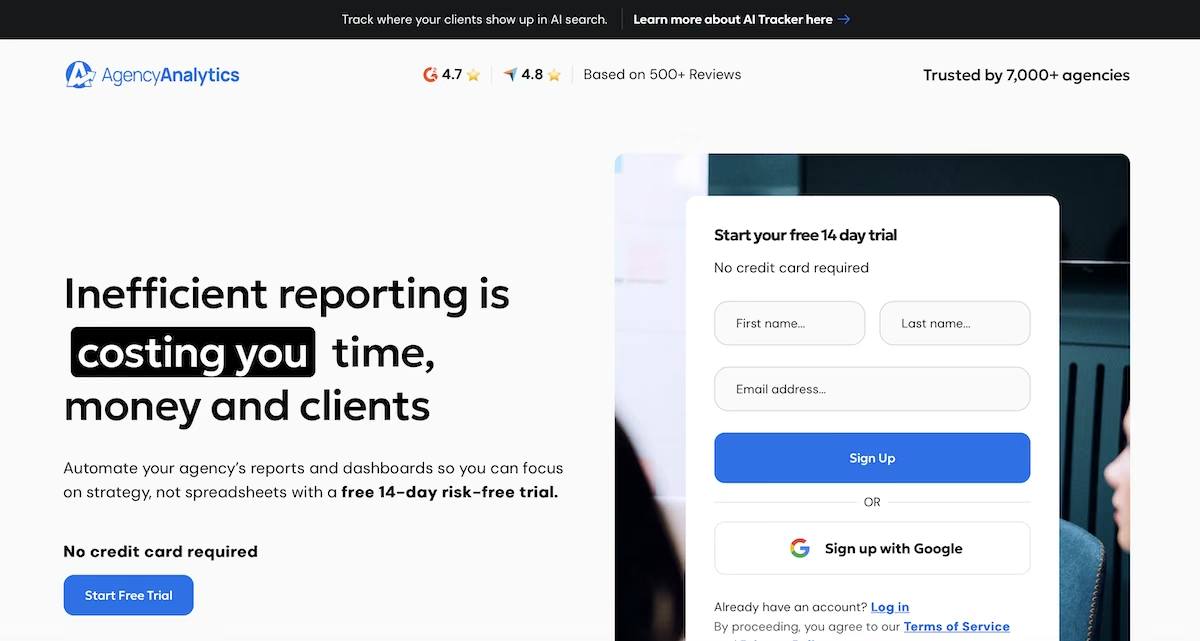
What it does: AgencyAnalytics pulls client marketing data from connected platforms into dashboards and reports that you can brand, schedule, and share.
Best for: Marketing agencies that report on several channels for each client and want clients to see results under the agency's brand.
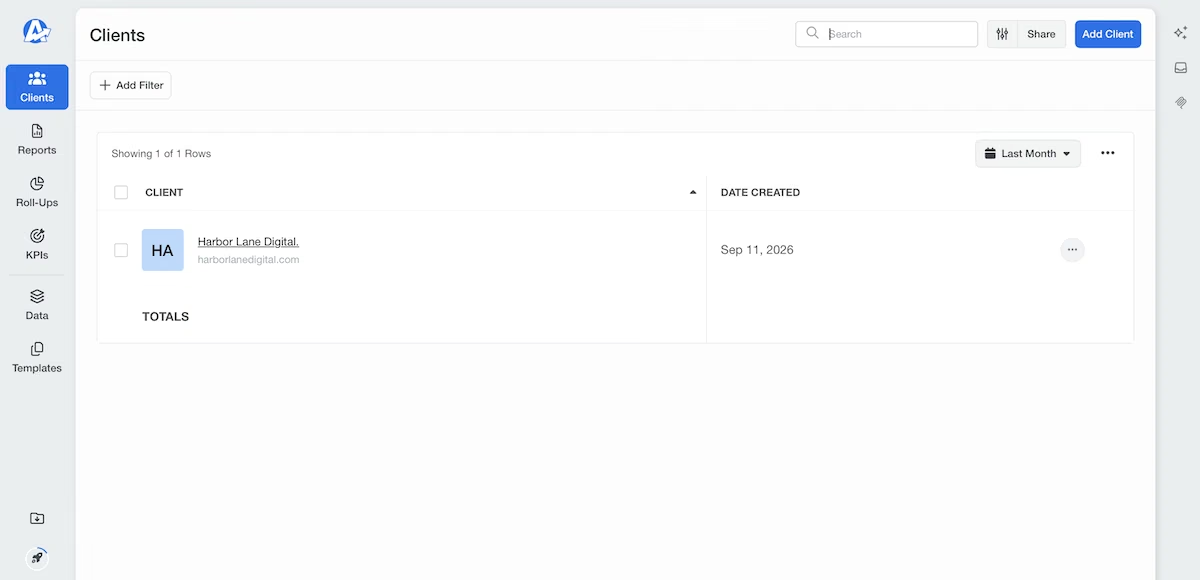
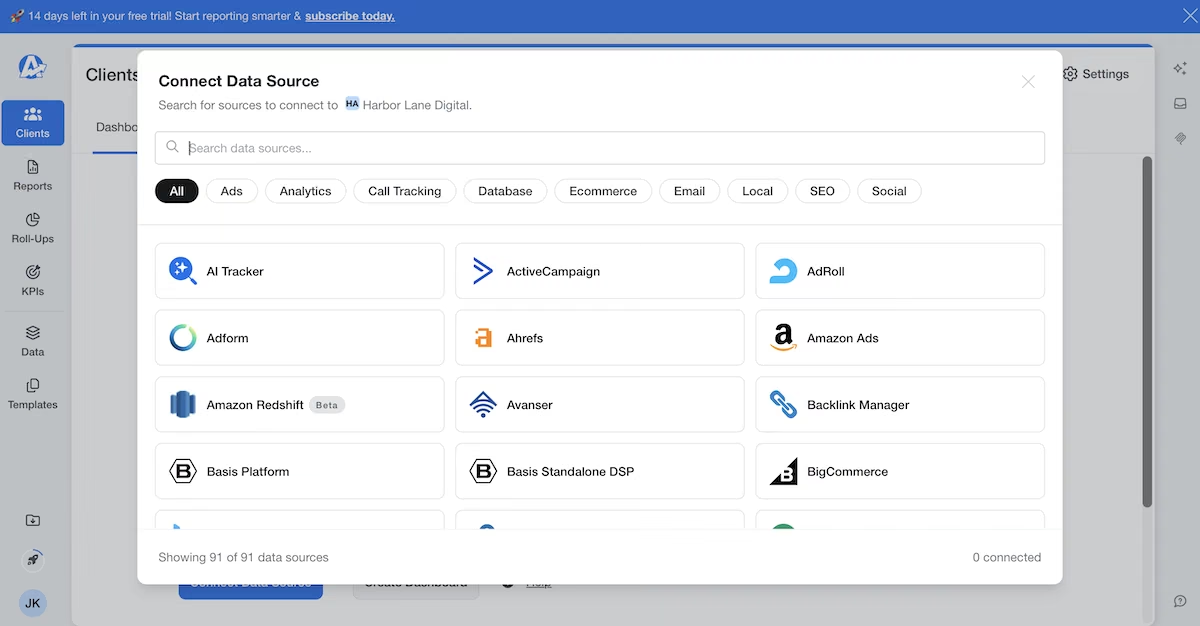
I signed up for AgencyAnalytics' 14-day trial with no credit card required. The tool then asked for my agency name and created it as my first client. The Connect Data Source screen listed 91 data sources the day I signed up, against the 85+ AgencyAnalytics publishes.
AgencyAnalytics retired the prebuilt demo client for new accounts in September 2026. My account didn't have one, so the only sample data I could access was the Sample Data toggle in the report builder. Have a client's details ready before the 14 days start. If you’re planning to sign up for the trial, have a client's details ready to enter before the 14 days start.
Since I couldn't build a dashboard without a client's data, everything below comes from the AgencyAnalytics site and its support articles. Once you connect a data source, Smart Dashboards build a starting dashboard from the top metrics of each integration, which AgencyAnalytics says takes about 11 seconds.
AgencyAnalytics’ KPIs section lets you set a one-time or recurring target for a metric and add an alert when a client goes off track. That's the client-reporting equivalent of an overdue flag, although KPI data only refreshes every 12 hours.
You can schedule reports with an optional approval step, download them as a PDF, or share a read-only link that clients can open without needing to log in. AgencyAnalytics charges one price per client and includes all of its features.
Key Features
- Smart Dashboards: Generate a starting dashboard from each client's connected integrations, then adjust the widgets.
- KPIs and alerts: Set targets for a specific metric, and AgencyAnalytics notifies you when a client falls behind.
- White-label reports: Send scheduled reports and share links under your own logo, colors, and domain.
Pros and Cons
Pros:
- A large integration library covers most marketing channels.
- Every plan includes all features, including white label and the client portal.
- Report approvals let you check a scheduled report before it reaches a client.
Cons:
- Per-client pricing adds up as your client list grows.
- You can't see much during the trial until you connect real client accounts.
- KPI data refreshes every 12 hours, so alerts aren't instant.
What Users Say
“Agency Analytics enables us to centralize all our analytics data from multiple sources into a single, streamlined system.” - Mike D. (G2)
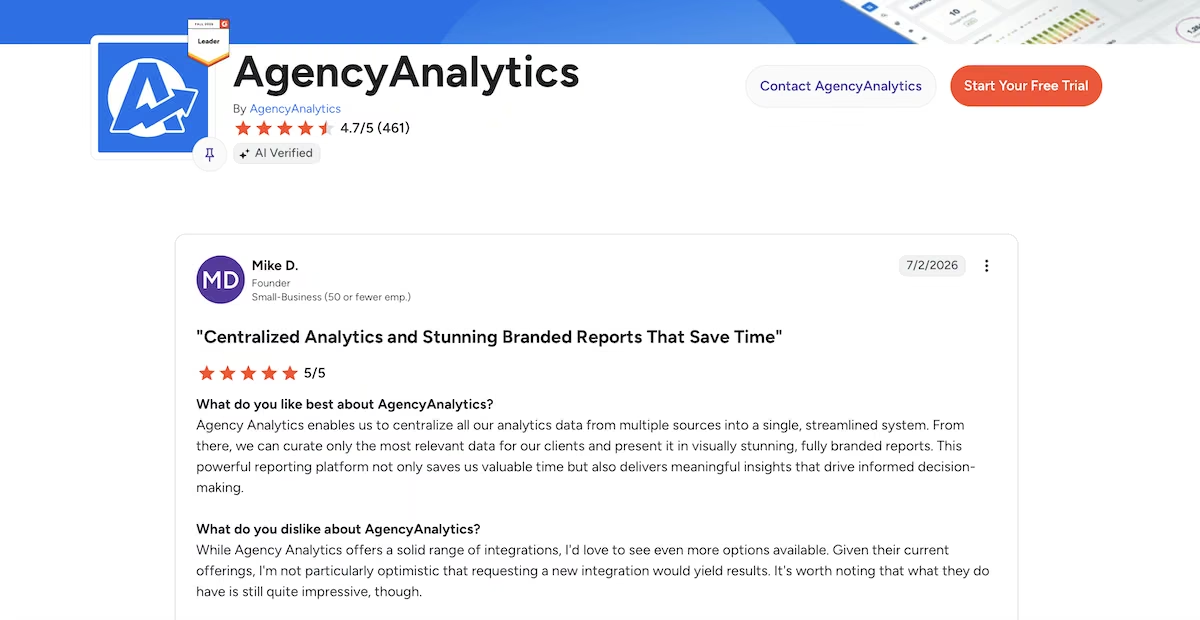
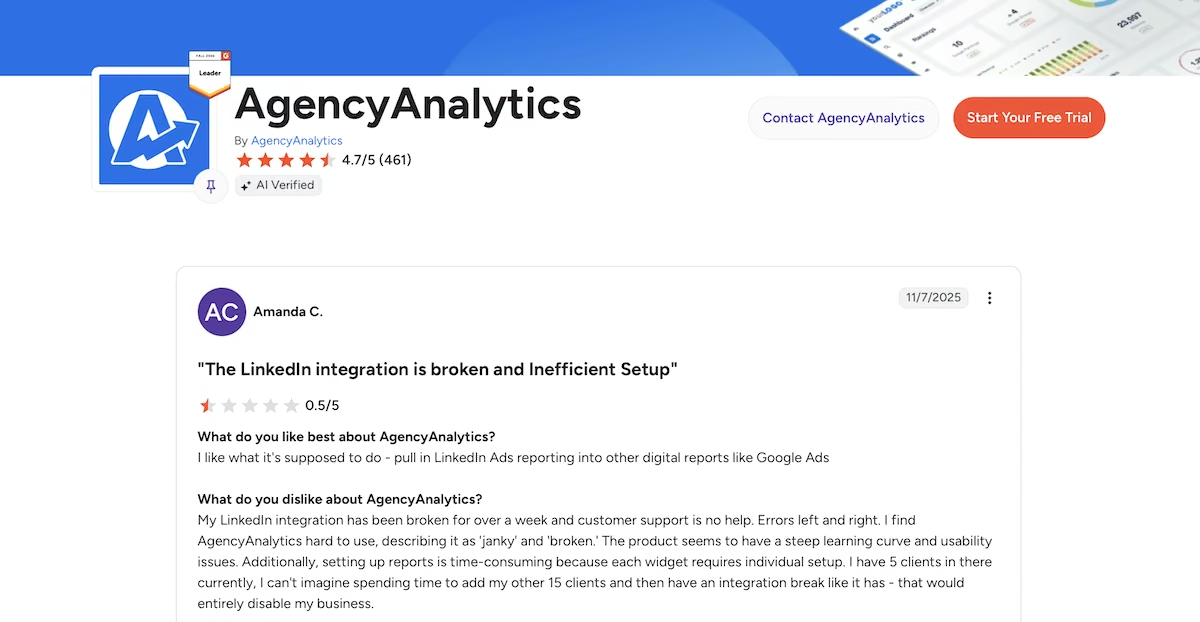
“I have 5 clients in there currently, I can't imagine spending time to add my other 15 clients and then have an integration break like it has - that would entirely disable my business.” - Amanda C. (G2)
Pricing
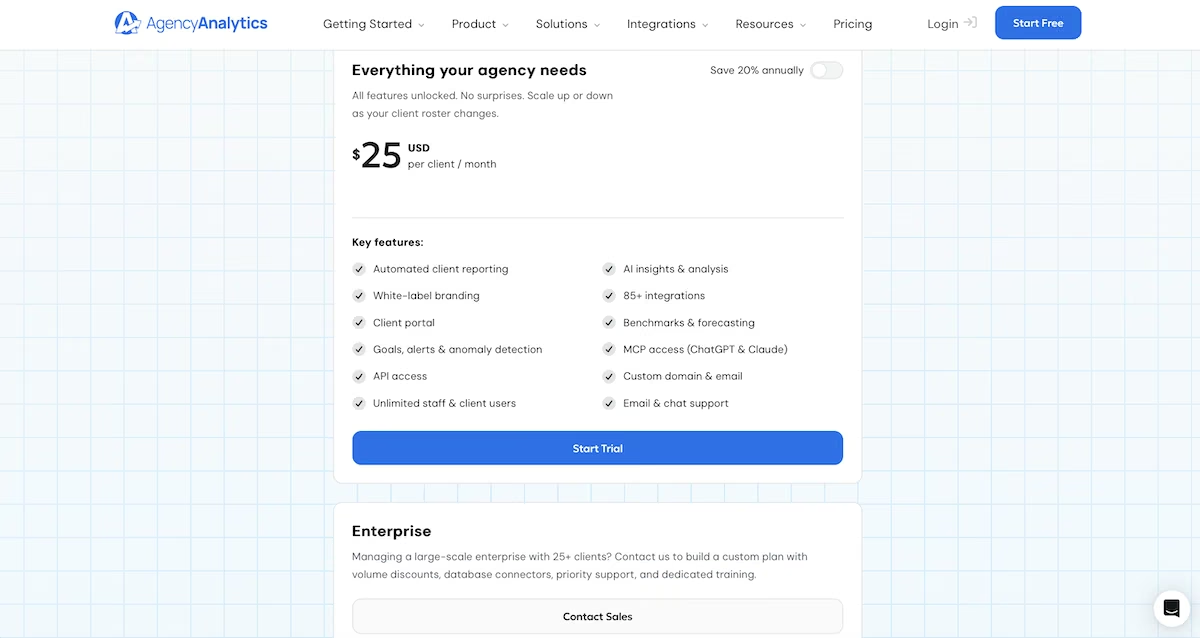
AgencyAnalytics charges per client on one plan at $25 per client per month, which drops by 20% if you pay annually. Every feature is included: white-label branding, the client portal, goals and alerts, 85+ integrations, API access, and unlimited staff and client users. Agencies with 25 or more clients move onto a custom Enterprise plan.
Bottom Line
Shortlist AgencyAnalytics if client reporting across several channels takes up a lot of your time and you want reports to show your branding. Small agencies with only a few clients should compare the per-client cost against DashThis first.
DashThis: Best for Simple Client Dashboards Priced by the Dashboard
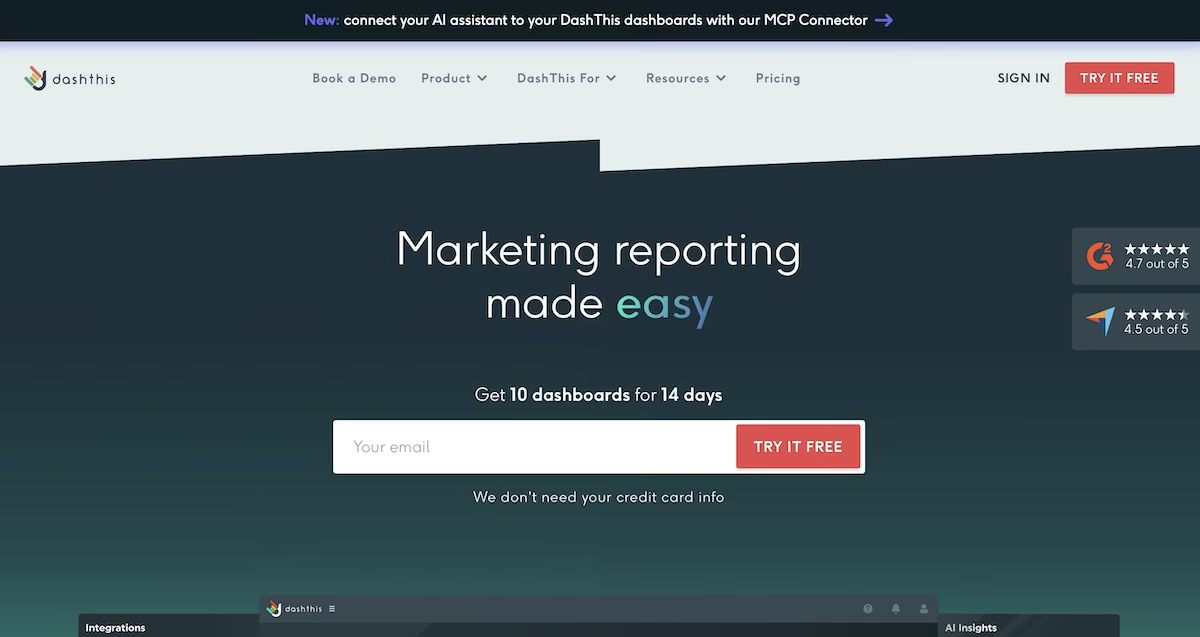
What it does: DashThis turns data from your marketing platforms into client dashboards, where each dashboard works as a single report you can share or email automatically.
Best for: Freelancers and small agencies with a handful of clients who want clean dashboards and little setup.
I haven't run a client dashboard in DashThis, so this section comes from its product pages, support articles, and customer reviews. Its model is simple: a dashboard is one marketing report, and it can pull from several platforms at once, so most agencies build one dashboard per client.
Its pricing follows that model. DashThis sizes each plan by dashboards and connected sources, and each connected account, such as a GA4 property or an ad account, counts as one source no matter how many widgets use it. The basic plan includes three dashboards and 15 sources.
Every plan includes the same core features: white-label dashboards, a custom domain, automated email dispatch, PDF export, and link sharing. A small agency doesn't have to upgrade to a higher tier just to remove DashThis branding.
The built-in AI Insights give four preset reads on each dashboard: a summary, wins, issues, and opportunities. If you wanted to ask your own questions or add client context, you’d need the AI Insights Pro add-on.
Key Features
- Preset templates: Start from prebuilt dashboards filled with common KPIs for each marketing channel.
- Automated email dispatch: Send each client an updated dashboard on your own schedule.
- Data aggregation: Combine data from several accounts, such as Google Ads and Facebook Ads spend, into one figure.
Pros and Cons
Pros:
- Each plan includes white label, a custom domain, and custom email.
- Templates make dashboards quick to set up.
- Each plan includes unlimited users.
Cons:
- Source limits per plan can force an upgrade before you run out of dashboards.
- Chat-style AI analysis costs extra.
- Only the Business plan and above include a customer success specialist and priority support.
What Users Say
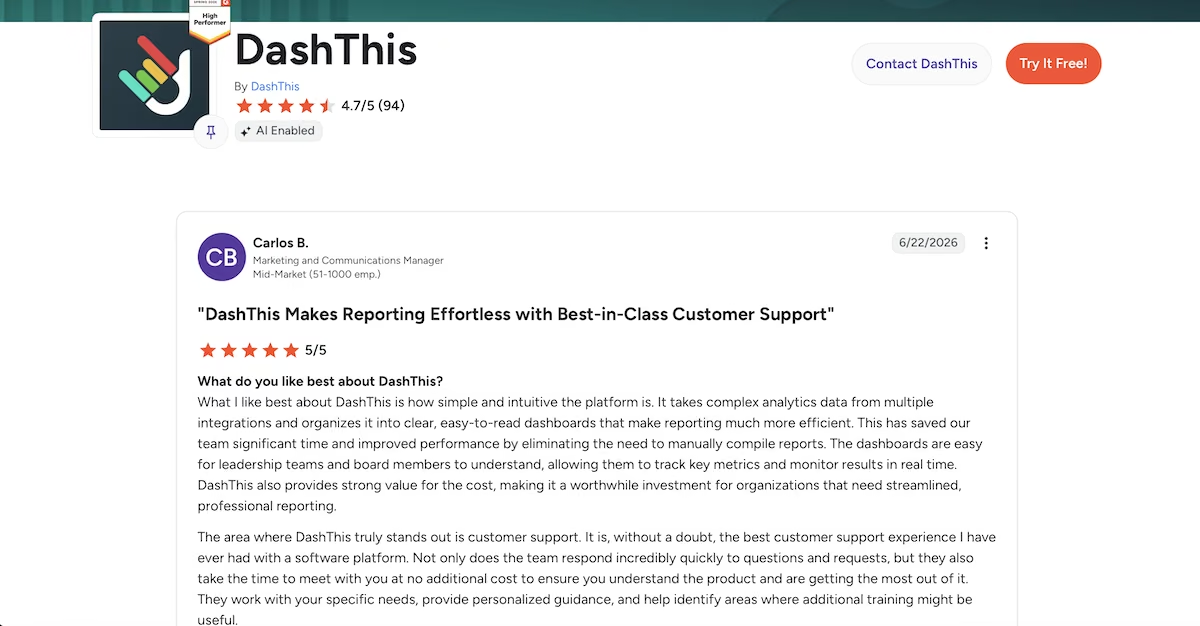
“What I like best about DashThis is how simple and intuitive the platform is.” Carlos B. (G2)
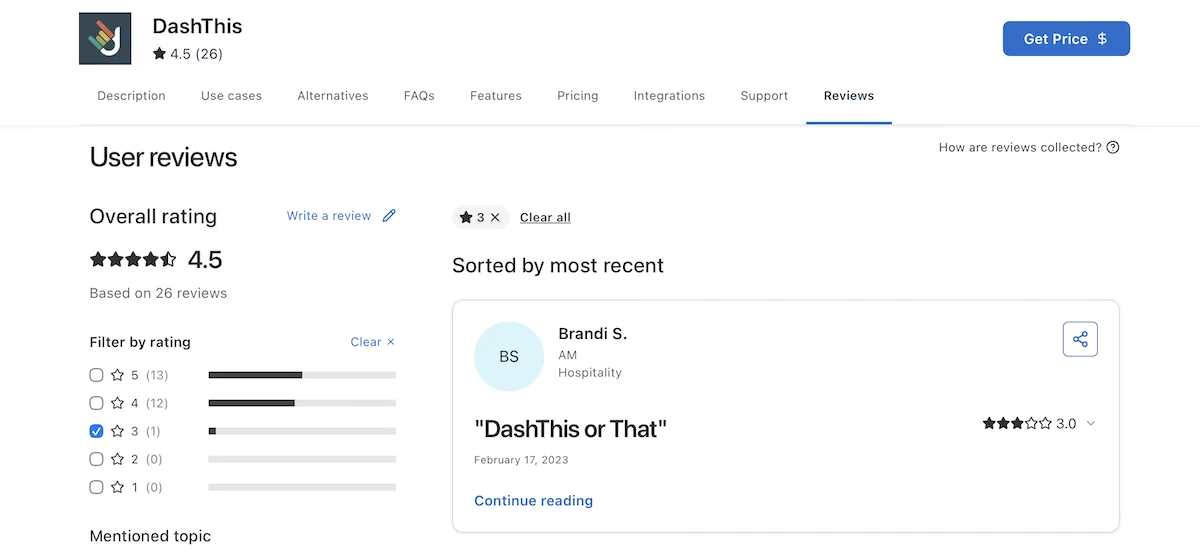
“Im not the biggest fan of DashThis, partly based on how we use it as a company but also just the visual aspect.” - Brandi S. (Capterra)
Pricing
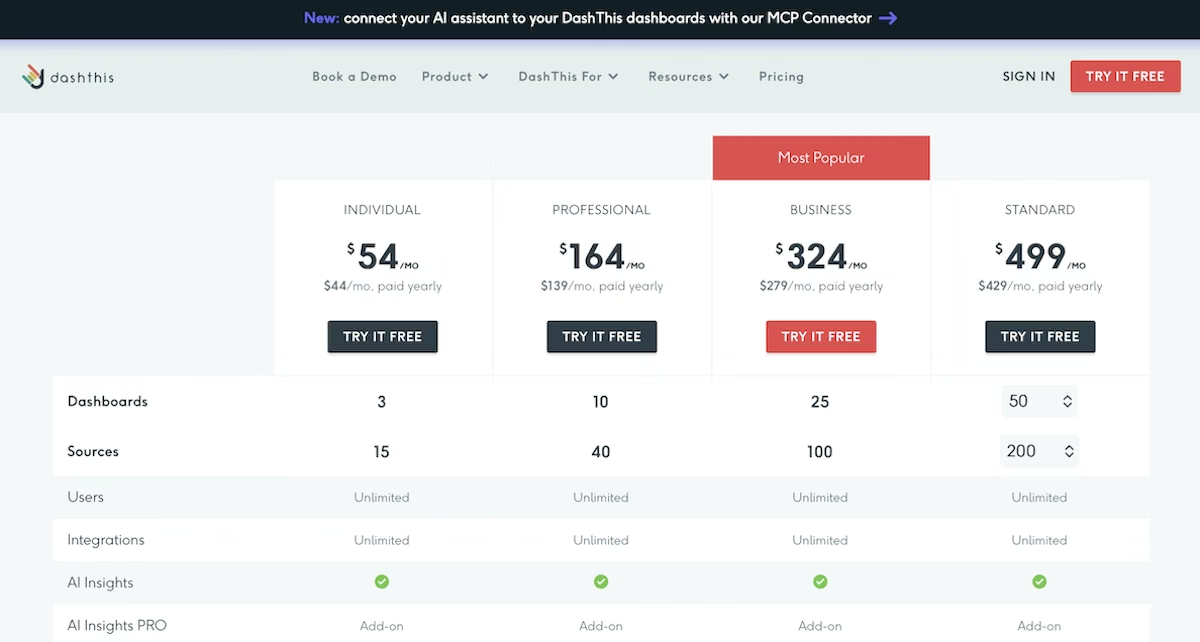
DashThis’ Individual plan costs $54/month, or $44/month paid yearly, for three dashboards and 15 sources. DashThis names its tiers Individual, Professional, Business, and Standard, which doesn't run from cheapest to priciest the way you'd expect.
Professional costs $164/month for 10 dashboards and 40 sources, Business costs $324/month for 25 and 100, and Standard, the largest, starts at $499/month for 50 and 200. Every plan includes unlimited users and integrations.
Bottom Line
DashThis suits a freelancer or small agency that wants branded client dashboards without paying for extra features. Once you manage dozens of clients across many channels, compare its source limits against AgencyAnalytics' per-client pricing.
Agency Dashboard: Best for SEO-Focused Agencies

What it does: Agency Dashboard combines client reporting with SEO tools such as rank tracking, site audits, and backlink monitoring, and it sends scheduled, white-label reports.
Best for: SEO-led agencies that want rankings, audits, and client reports in one subscription.
I read through the feature pages, pricing table, and reviews for this one without taking a trial. Agency Dashboard builds its plans around campaigns and tracked keywords instead of clients or dashboards. The Starter plan covers one campaign and 50 tracked keywords, while the Agency plan covers 50 campaigns and up to 1,500 keywords.
Every plan includes unlimited user seats and unlimited view-only client logins. The pricing page lists SEO, ads, social, and Google Business Profile dashboards, alongside scheduled reports and white-label reporting.
It goes further than most reporting tools on SEO, with daily rank tracking, unlimited site audits, backlink monitoring, keyword research, and a set of AI content tools with daily limits. Its menu also includes project management and uptime monitoring.
Independent feedback leaves the biggest gap. Its G2 profile has a single review, and there are none on sites like Trustpilot and Capterra. So you have far less evidence of how it performs over time than you do for AgencyAnalytics or DashThis.
Key Features
- Rank tracking: Track daily keyword positions on desktop and mobile, including local rankings.
- Site audits and backlinks: Run unlimited audits and watch backlink growth for each client.
- Scheduled white-label reports: Send clients branded reports automatically.
Pros and Cons
Pros:
- SEO tools and client reporting in one plan.
- Every plan includes unlimited users and view-only client logins.
- A low-cost Starter plan lets a freelancer start small.
Cons:
- Very few independent reviews exist to judge it by.
- Pricing by campaigns and keywords takes some math to compare.
- Keyword limits can push SEO-heavy agencies onto higher tiers.
What Users Say
Agency Dashboard is a relatively new tool, and its review count is still thin. That may change, so it's worth checking Agency Dashboard's G2 review page before you commit.
“One of the most comprehensive all inclusive data reporting dashboard tools on the internet right now” - Micah L. (G2)

Pricing

Agency Dashboard’s Starter plan costs $5/month for one campaign and 50 tracked keywords. Freelancer costs $35/month for 10 campaigns and 250 keywords, and Agency costs $125/month for 50 campaigns and 1,500 keywords. Agency Plus costs $195/month for unlimited campaigns and 3,000 keywords, and Enterprise costs $700/month with 15,000 keywords.
Bottom Line
Agency Dashboard fits an SEO agency that wants rankings, audits, and reports on a single bill. If most of your reporting is on paid ads or social, a broader reporting tool will likely suit you better.
Data Studio: Best for Free Reporting on Google Data

What it does: Data Studio is Google's free tool for turning data from Google products and other sources into interactive reports and dashboards you can share.
Best for: Agencies whose clients mainly use GA4, Google Ads, and Search Console, and that are comfortable building reports.
Google renamed Looker Studio to Data Studio in April 2026. I haven't built a report in Data Studio, so what follows comes from Google's documentation and customer reviews.
The tool’s biggest advantage is price: the standard version costs nothing, and connecting Google products like GA4, Google Ads, and Search Console is free.
Non-Google data is where it gets expensive. Pulling in sources like Meta or LinkedIn usually means paying for a third-party connector, so the free tool stops being free as soon as your clients run ads outside Google.
Data Studio gives you a blank canvas, so there's no client list or client portal, and you design and brand each report yourself.
Ownership raises the other point to plan for. In the free version, reports belong to the person who created them. A Pro subscription links to one Google Cloud project and gives your organization team workspaces and shared ownership. Google charges for every license each month, whether anyone uses it or not.
For an agency that keeps each client in a separate Google Cloud project, Pro costs multiply by project, so it's sensible to work out the numbers before upgrading.
Key Features
- Free Google connectors: Connect GA4, Google Ads, Search Console, Sheets, and BigQuery at no cost.
- Shareable reports: Share interactive reports and let viewers change date ranges and filters.
- Report templates: Start from Google's template gallery and adapt a layout instead of building from scratch.
Pros and Cons
Pros:
- The standard version is free.
- Google data connects without extra tools.
- Reports flex to whatever layout you want to design.
Cons:
- Non-Google data usually needs a paid connector.
- It doesn’t include a client management or a client portal.
- In the free version, reports belong to individual users, which causes problems when someone leaves.
What Users Say
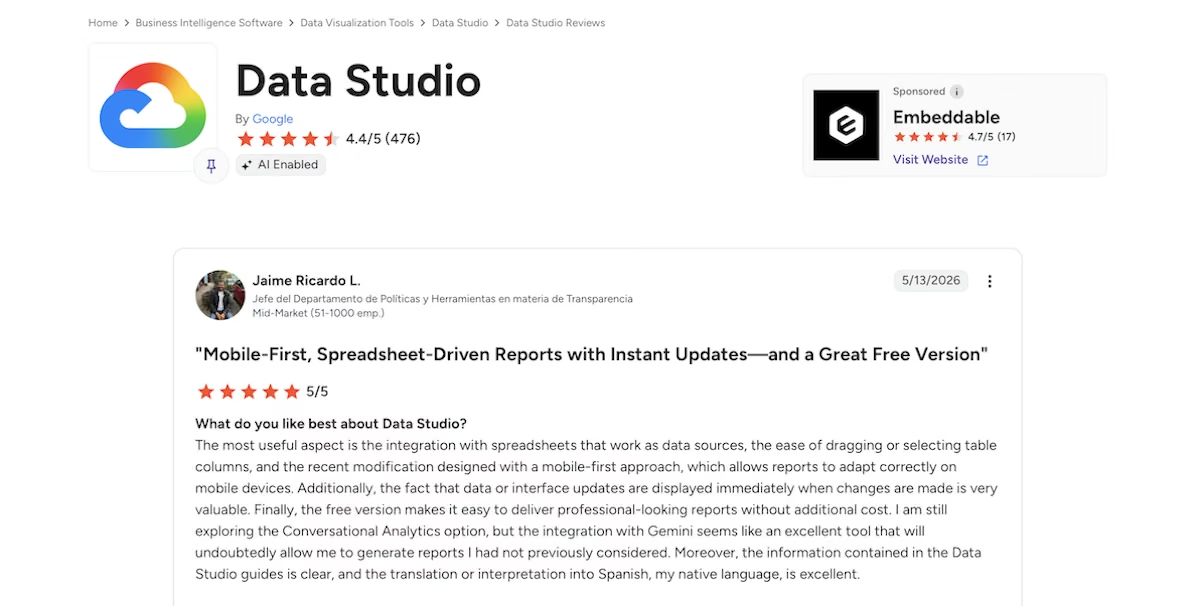
“The most useful aspect is the integration with spreadsheets that work as data sources” - Jaime Ricardo L. (G2)
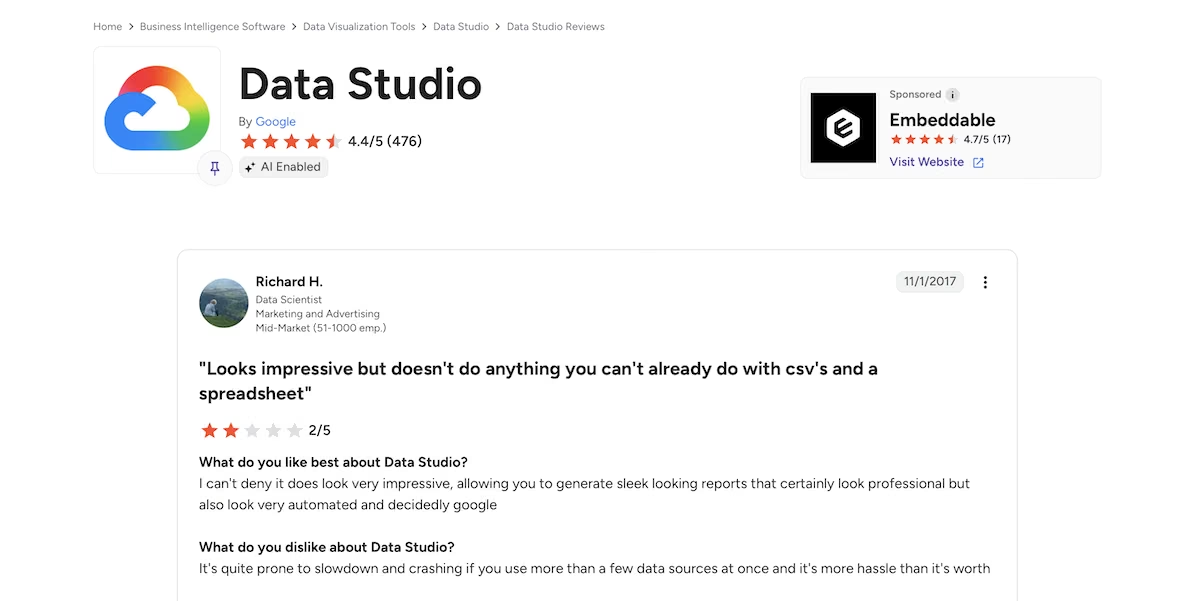
"It's quite prone to slowdown and crashing if you use more than a few data sources at once" - Ricardo H. (G2)
Pricing
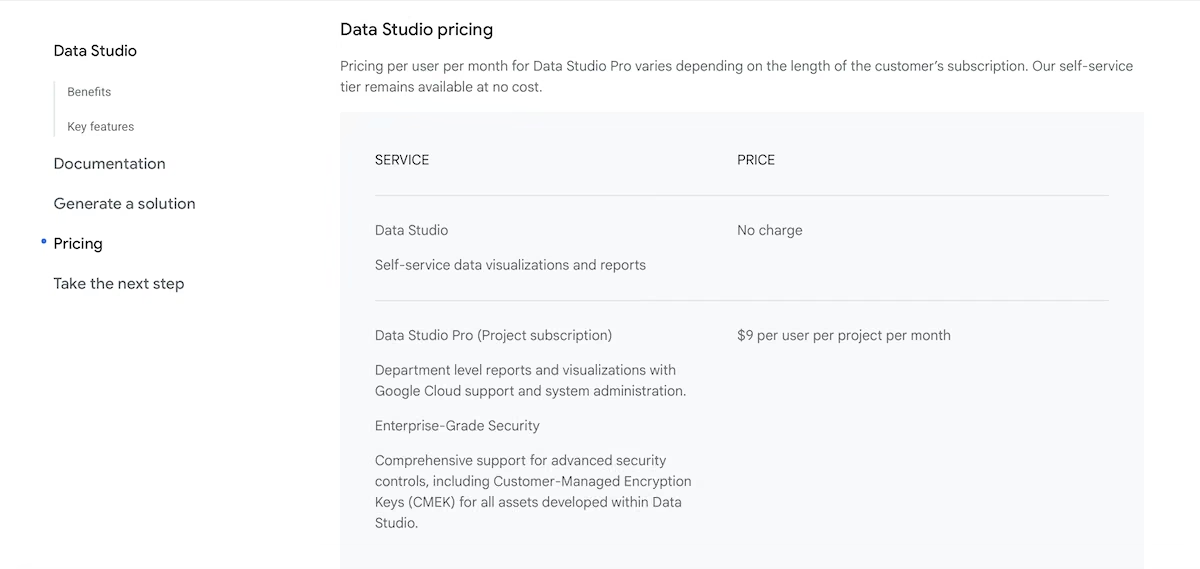
Google doesn’t charge for basic Data Studio, which covers self-service visualizations and reports. Data Studio Pro costs $9 per user per project per month and adds department-level reporting, Google Cloud support, system administration, and customer-managed encryption keys. Third-party connectors for non-Google data are billed by their providers.
Bottom Line
Start with Data Studio if your clients' data comes from Google products and your team enjoys building reports by hand. Once you need several non-Google sources or a proper client portal, a dedicated reporting tool usually costs less overall.
Which Agency Dashboard Tool Should You Choose?
If you mainly report results to clients, one of the four reporting tools will get you there faster. If you want to track your own projects, deadlines, and workload, you'll probably need to build it.
Choose Emergent if you:
- Want one dashboard that covers your projects, deadlines, and team workload in the way your agency works.
- Want to own the code and add features, such as a client database or approvals, over time.
Choose Lovable if you:
- Want a polished internal tool you can publish quickly on a free plan.
- Are comfortable testing each screen yourself before sharing it.
Choose Bubble if you:
- Want to keep editing the dashboard in a visual editor.
- Need plugins and a database you can adjust yourself.
Choose AgencyAnalytics if you:
- Report on several marketing channels for each client.
- Want white-label reports, alerts, and a client portal from day one.
Choose DashThis if you:
- Manage a handful of clients and want simple, branded dashboards.
- Prefer paying per dashboard over paying per client.
Choose Agency Dashboard if you:
- Run an SEO-focused agency that tracks rankings and site health for clients.
- Want SEO tools and client reports under one subscription.
Choose Data Studio if you:
- Report mainly on Google data without spending anything.
- Have someone who can build and maintain reports by hand.
Skip this category entirely if:
- You only have one or two clients, and a shared spreadsheet already gives them what they need.
- You need a full business intelligence setup with data modeling across many internal systems.
If you're weighing app builders more broadly, our roundup of internal tool builders compares more options for operations dashboards.
Final Verdict
For client reporting across several channels, AgencyAnalytics and DashThis lead this list. Agency Dashboard makes more sense for an SEO agency, and Data Studio won’t cost you a cent if your clients' data is already in Google products.
For a dashboard that follows your own projects and rules, Emergent suited the job best of the tools I tested, because it built a dashboard that flagged the right projects from a single prompt and tested its own work before I checked it.
Emergent won't suit agencies whose clients expect detailed PDF reports every month, or teams that want a finished reporting template instead of a custom build. Those agencies should start with a reporting tool.
If your agency also needs a better way to manage client records, track leads, and organize sales workflows, explore how an AI CRM builder can help you create a CRM tailored to your agency's needs. For client portals, proposal tools, or anything else built around how your agency runs, our roundup of custom business software covers the options. When you're ready to build your own dashboard, you can start with Emergent for free.
Describe it. Build it. Launch it.
- End-to-End Creation
- No Code Needed
- Live in Minutes

Most AI app builders stop at prototypes. Emergent creates production-ready apps you can actually launch.
- Production-ready apps
- Web & mobile apps
- Deploy in minutes