TL;DR
- An operations dashboard is a live, single-screen view of the metrics that show whether day-to-day work is on track right now.
- The eight examples below cover IT, warehouse and inventory, health and safety, OKRs, finance, HR, customer support, and sustainability.
- Building one takes six steps: name the decision it drives, pick 5 to 10 metrics, connect live data sources, design for where it will be viewed, set thresholds, and assign an owner before launch.
An operations dashboard only earns its screen space if someone actually changes what they do because of it. Most don't. They get built during a busy quarter, get admired for a week, and by month three nobody notices when the numbers stop updating.
This guide starts with real examples organized by function, so you can see what a working operations dashboard actually tracks before you build one.
Then it covers the build steps, including the part most guides skip: why so many of these dashboards get abandoned, and what keeps one alive past launch.
What Is an Operations Dashboard?
An operations dashboard is a live, single-screen view of the metrics that show whether day-to-day work is on track right now.
It pulls data from the systems a team already uses (ERP, CRM, ticketing, inventory) and displays it so a manager can spot a problem and act before it compounds.
An operations dashboard answers what's happening in the business today. Strategic and analytical dashboards work across longer time windows to explain trends and support planning decisions. Both matter, and they answer different questions.
8 Operations Dashboard Examples by Function
These are the functions where operations dashboards show up most often, based on what actually gets built and used.
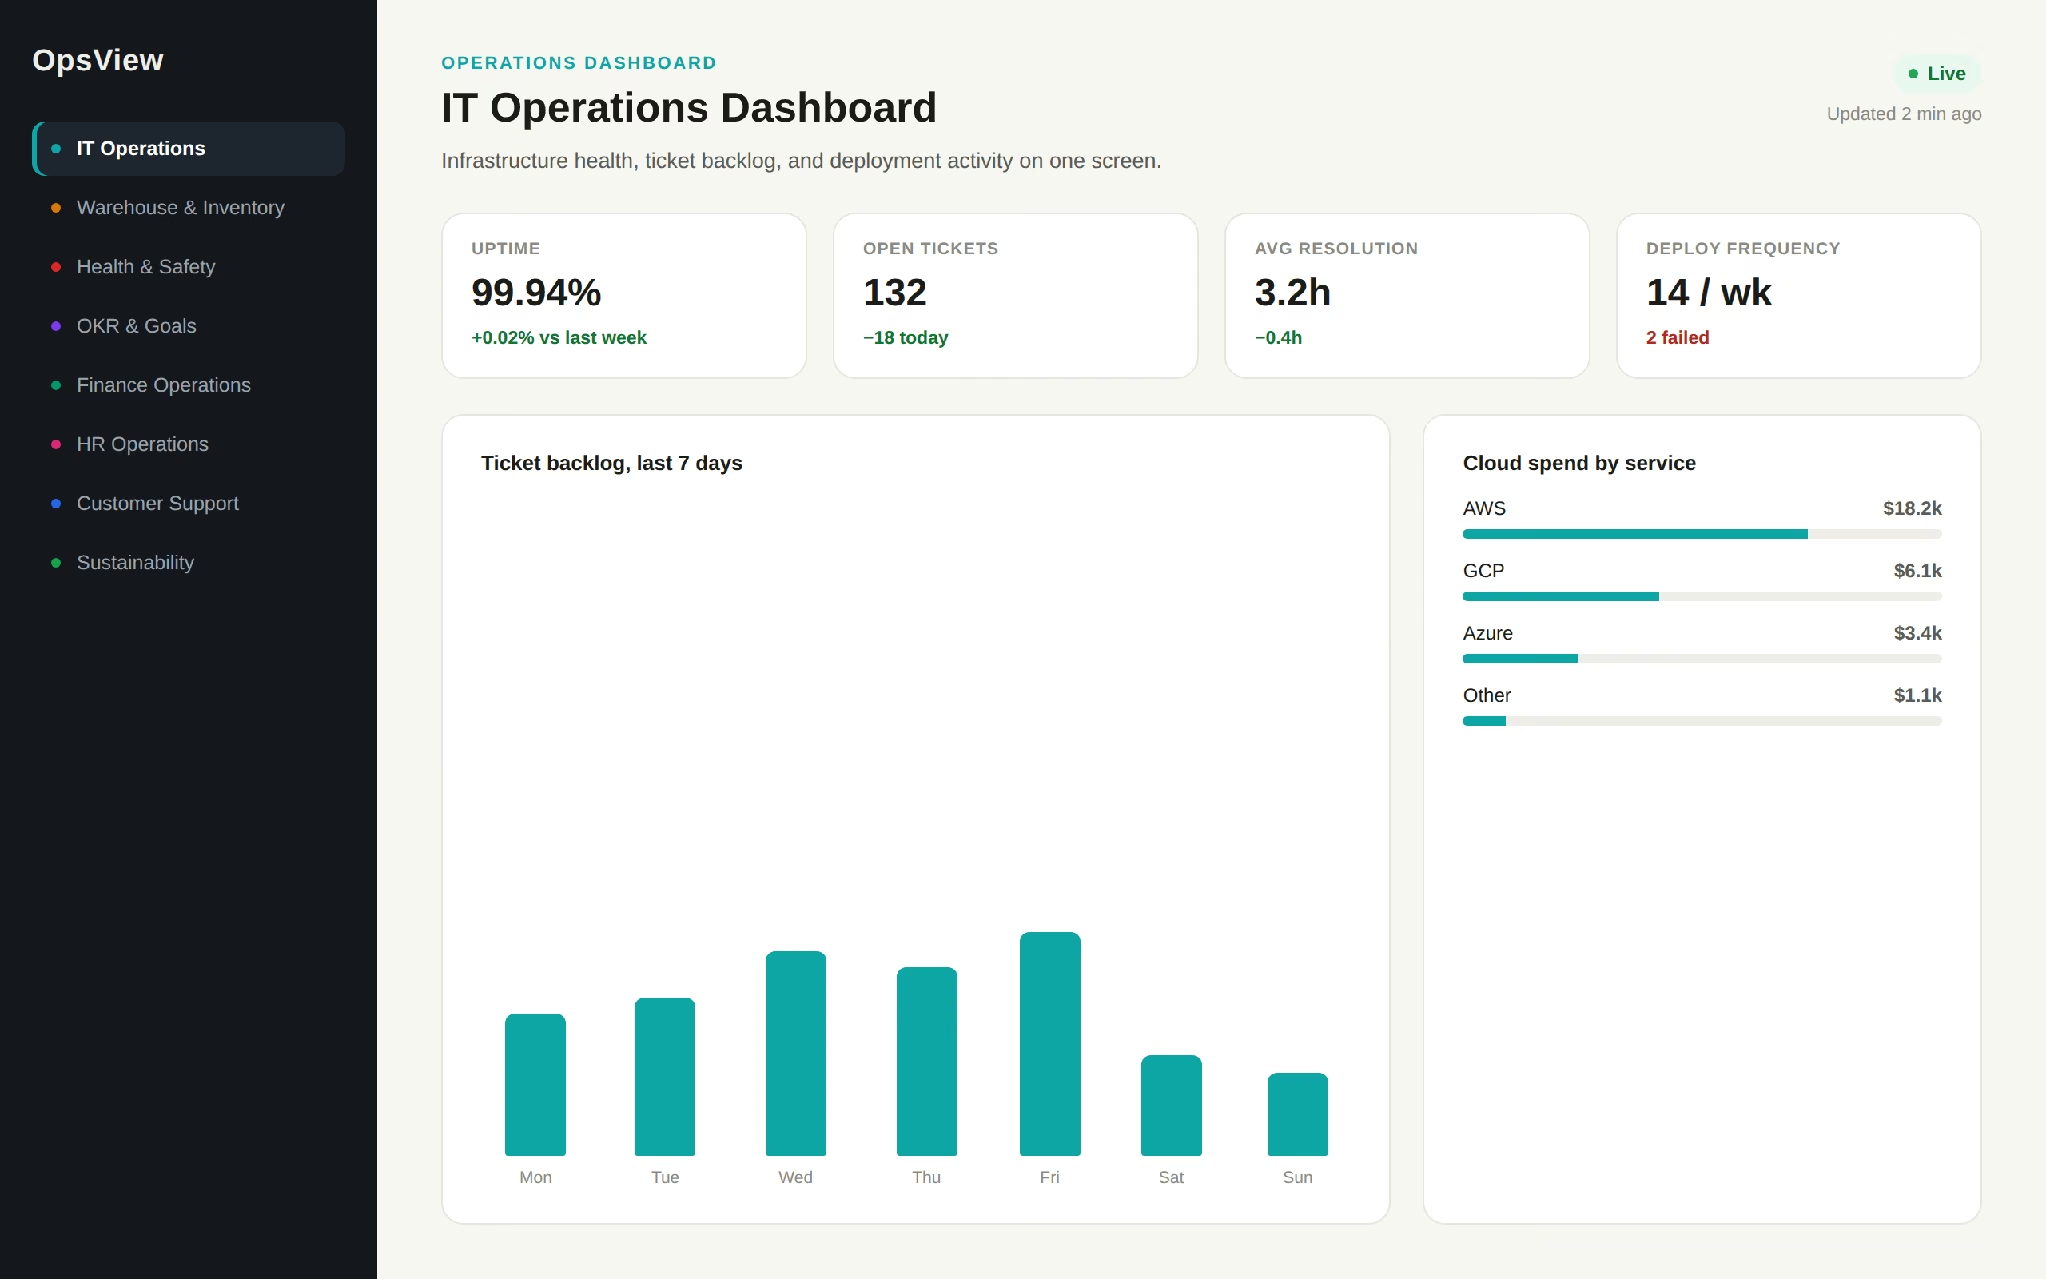
IT Operations Dashboard
Gives an IT team a single view of infrastructure health, ticket backlog, and deployment activity, so they can catch a building problem before it becomes an outage.
Common metrics:
- Server and service uptime
- Open ticket volume and average resolution time
- Cloud spend by service
- Deployment frequency and failure rate
A support team running this on a shared screen sees a ticket backlog spike within the hour and can reassign coverage the same morning.
Warehouse and Inventory Dashboard
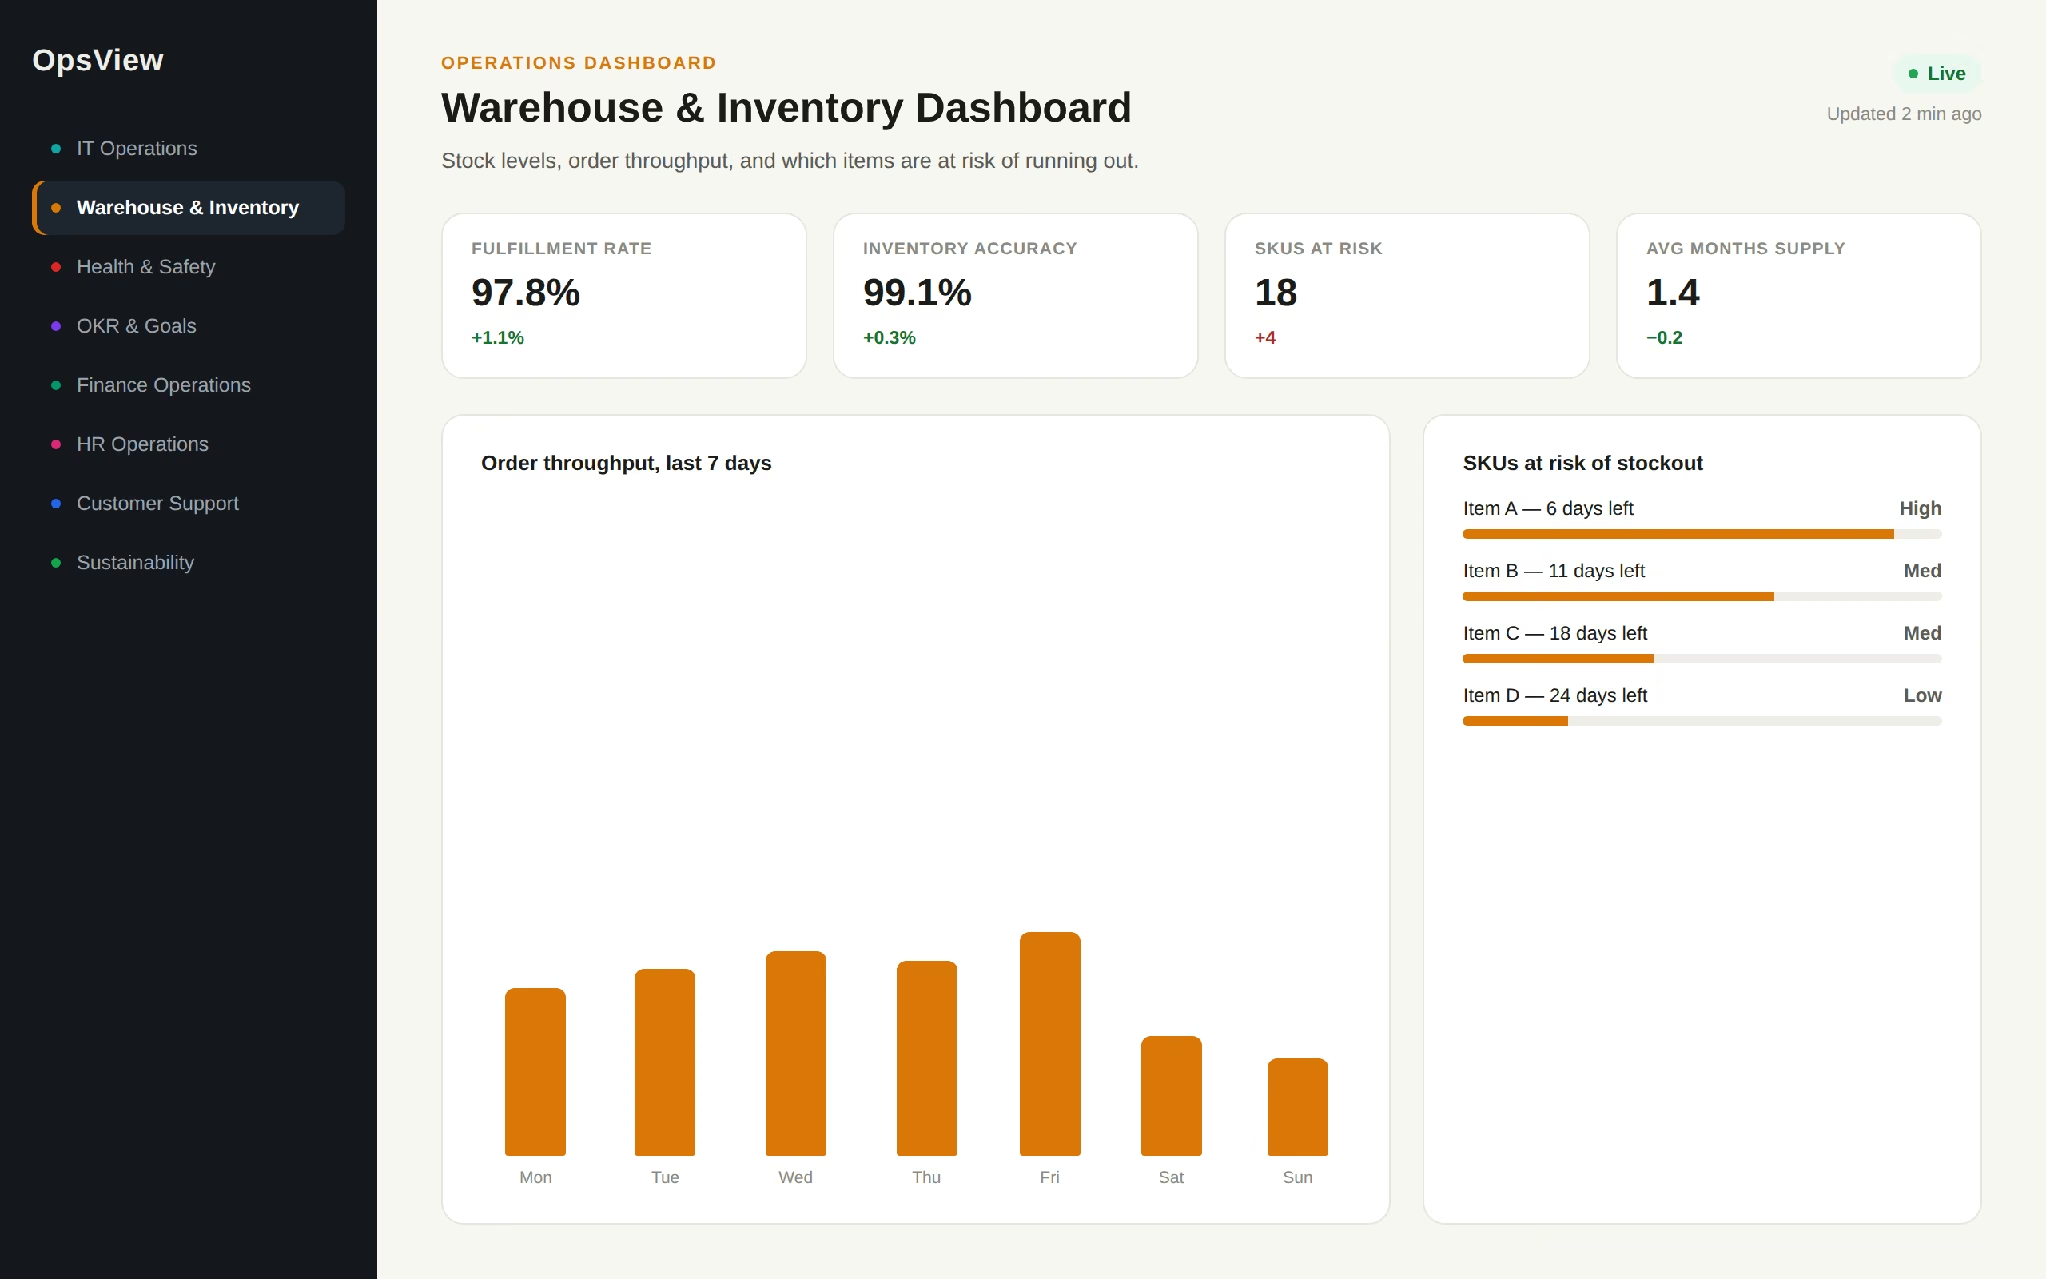
Gives operations and fulfillment teams a live read on stock levels, order throughput, and which items are at risk of running out.
Common metrics:
- Stock levels by SKU
- Months of supply remaining at current sales pace
- Order fulfillment rate
- Inventory accuracy rate
A furniture retailer tracking months-of-supply per item can reorder two weeks before a shortage instead of finding out from a customer complaint.
Health and Safety Dashboard
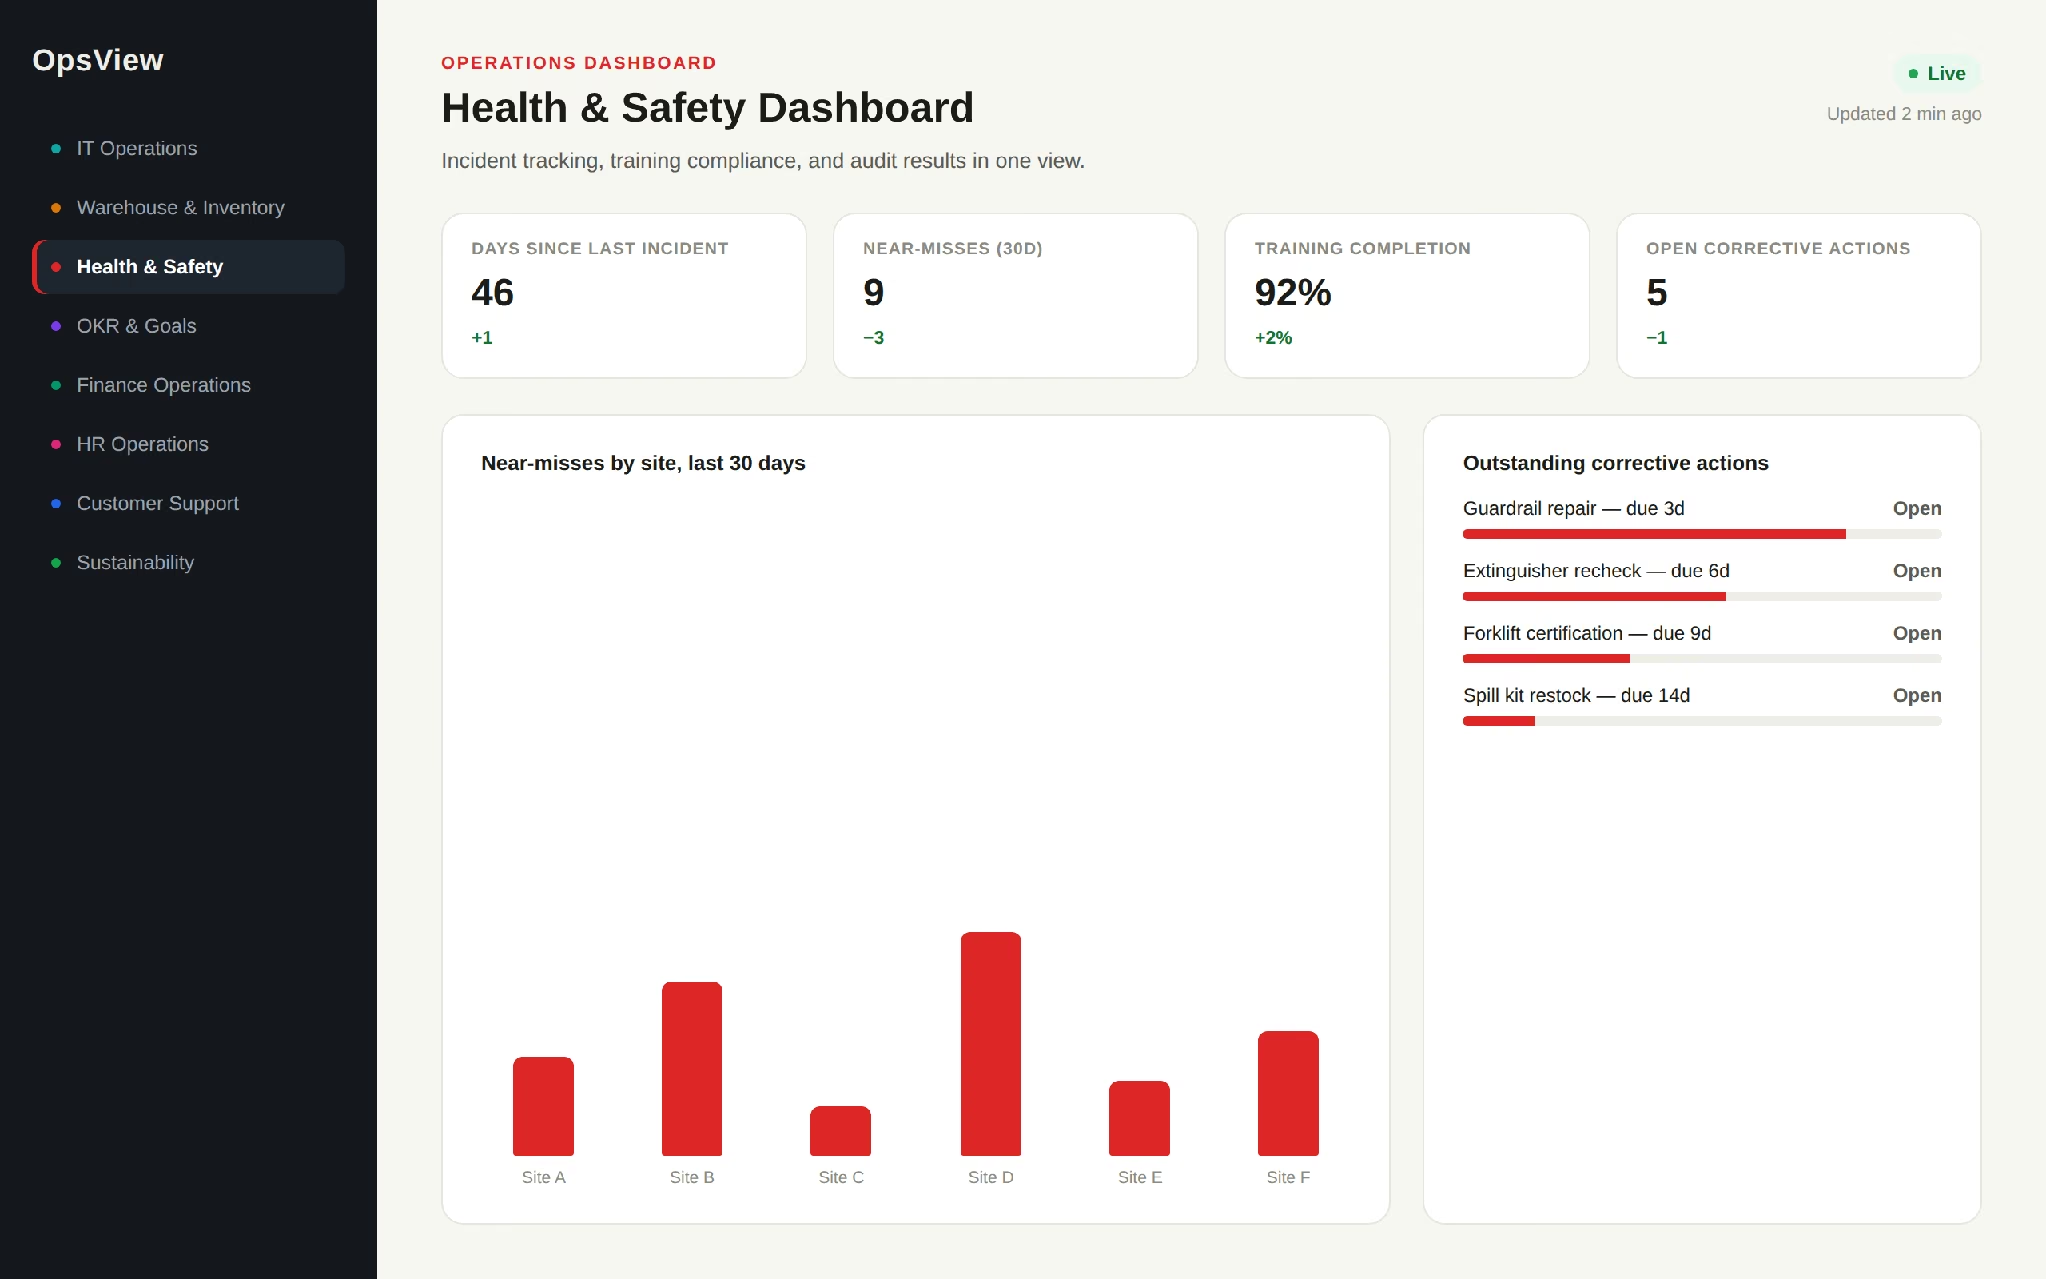
Centralizes incident tracking, training compliance, and audit results so safety issues show up as patterns across sites.
Common metrics:
- Incident and near-miss count by site
- Days since last incident
- Training completion rate
- Outstanding corrective actions
A facilities team tracking near-misses can spot a recurring hazard weeks before it causes a real accident.
OKR and Goals Dashboard
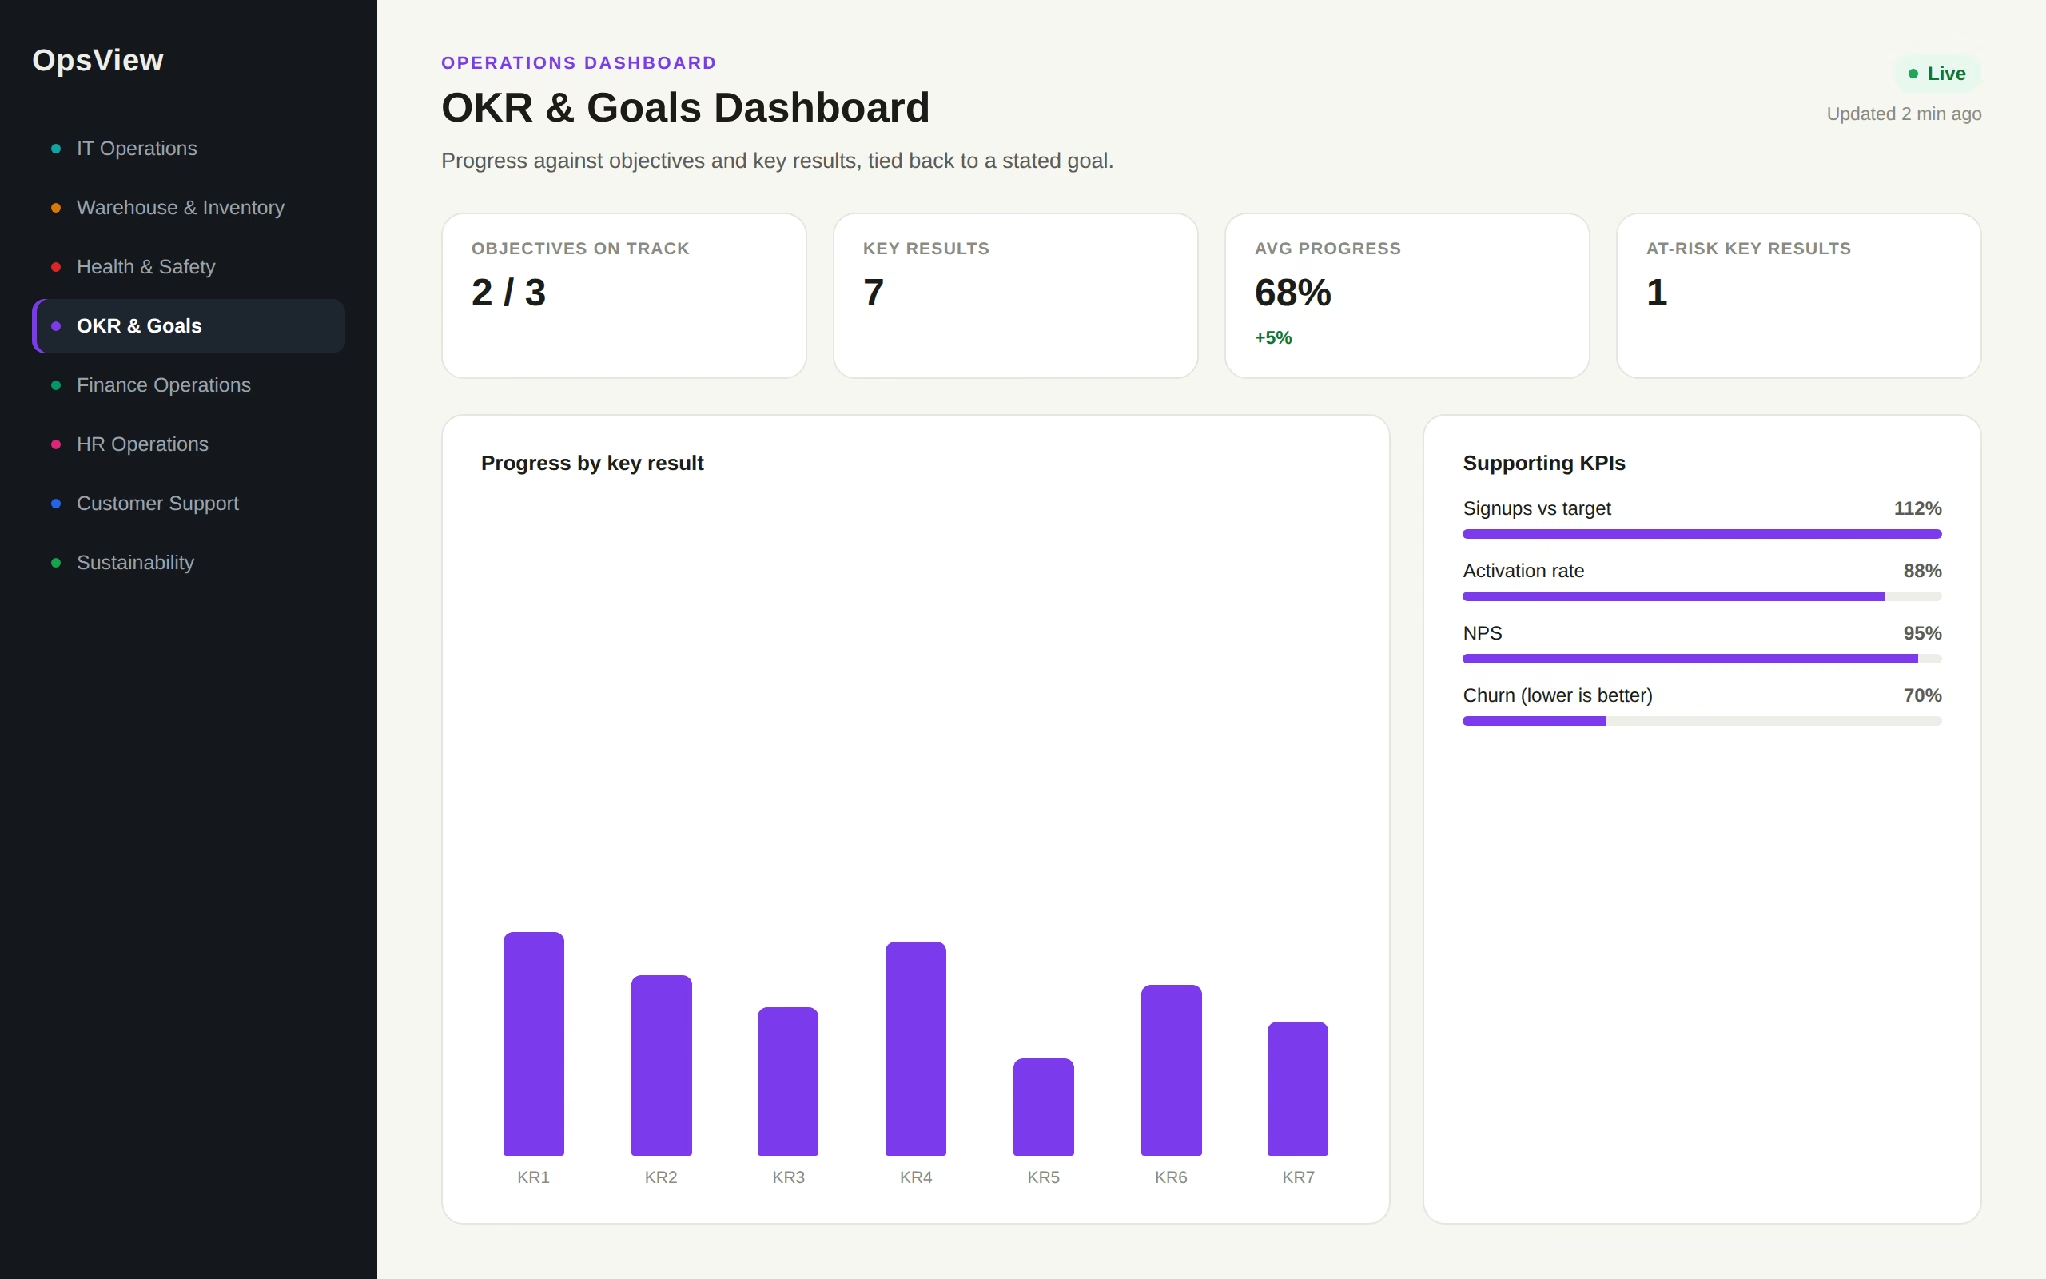
Tracks progress against a team or company's stated objectives and key results, tying day-to-day metrics back to a stated goal instead of showing numbers in isolation.
Common metrics:
- Progress toward each key result, as a percentage
- Supporting KPIs for context per result
- Goals broken out by team (marketing, support, operations)
A company tracking three key results toward a stated growth objective can see, at a glance, which key result is lagging and needs attention this week.
Finance Operations Dashboard
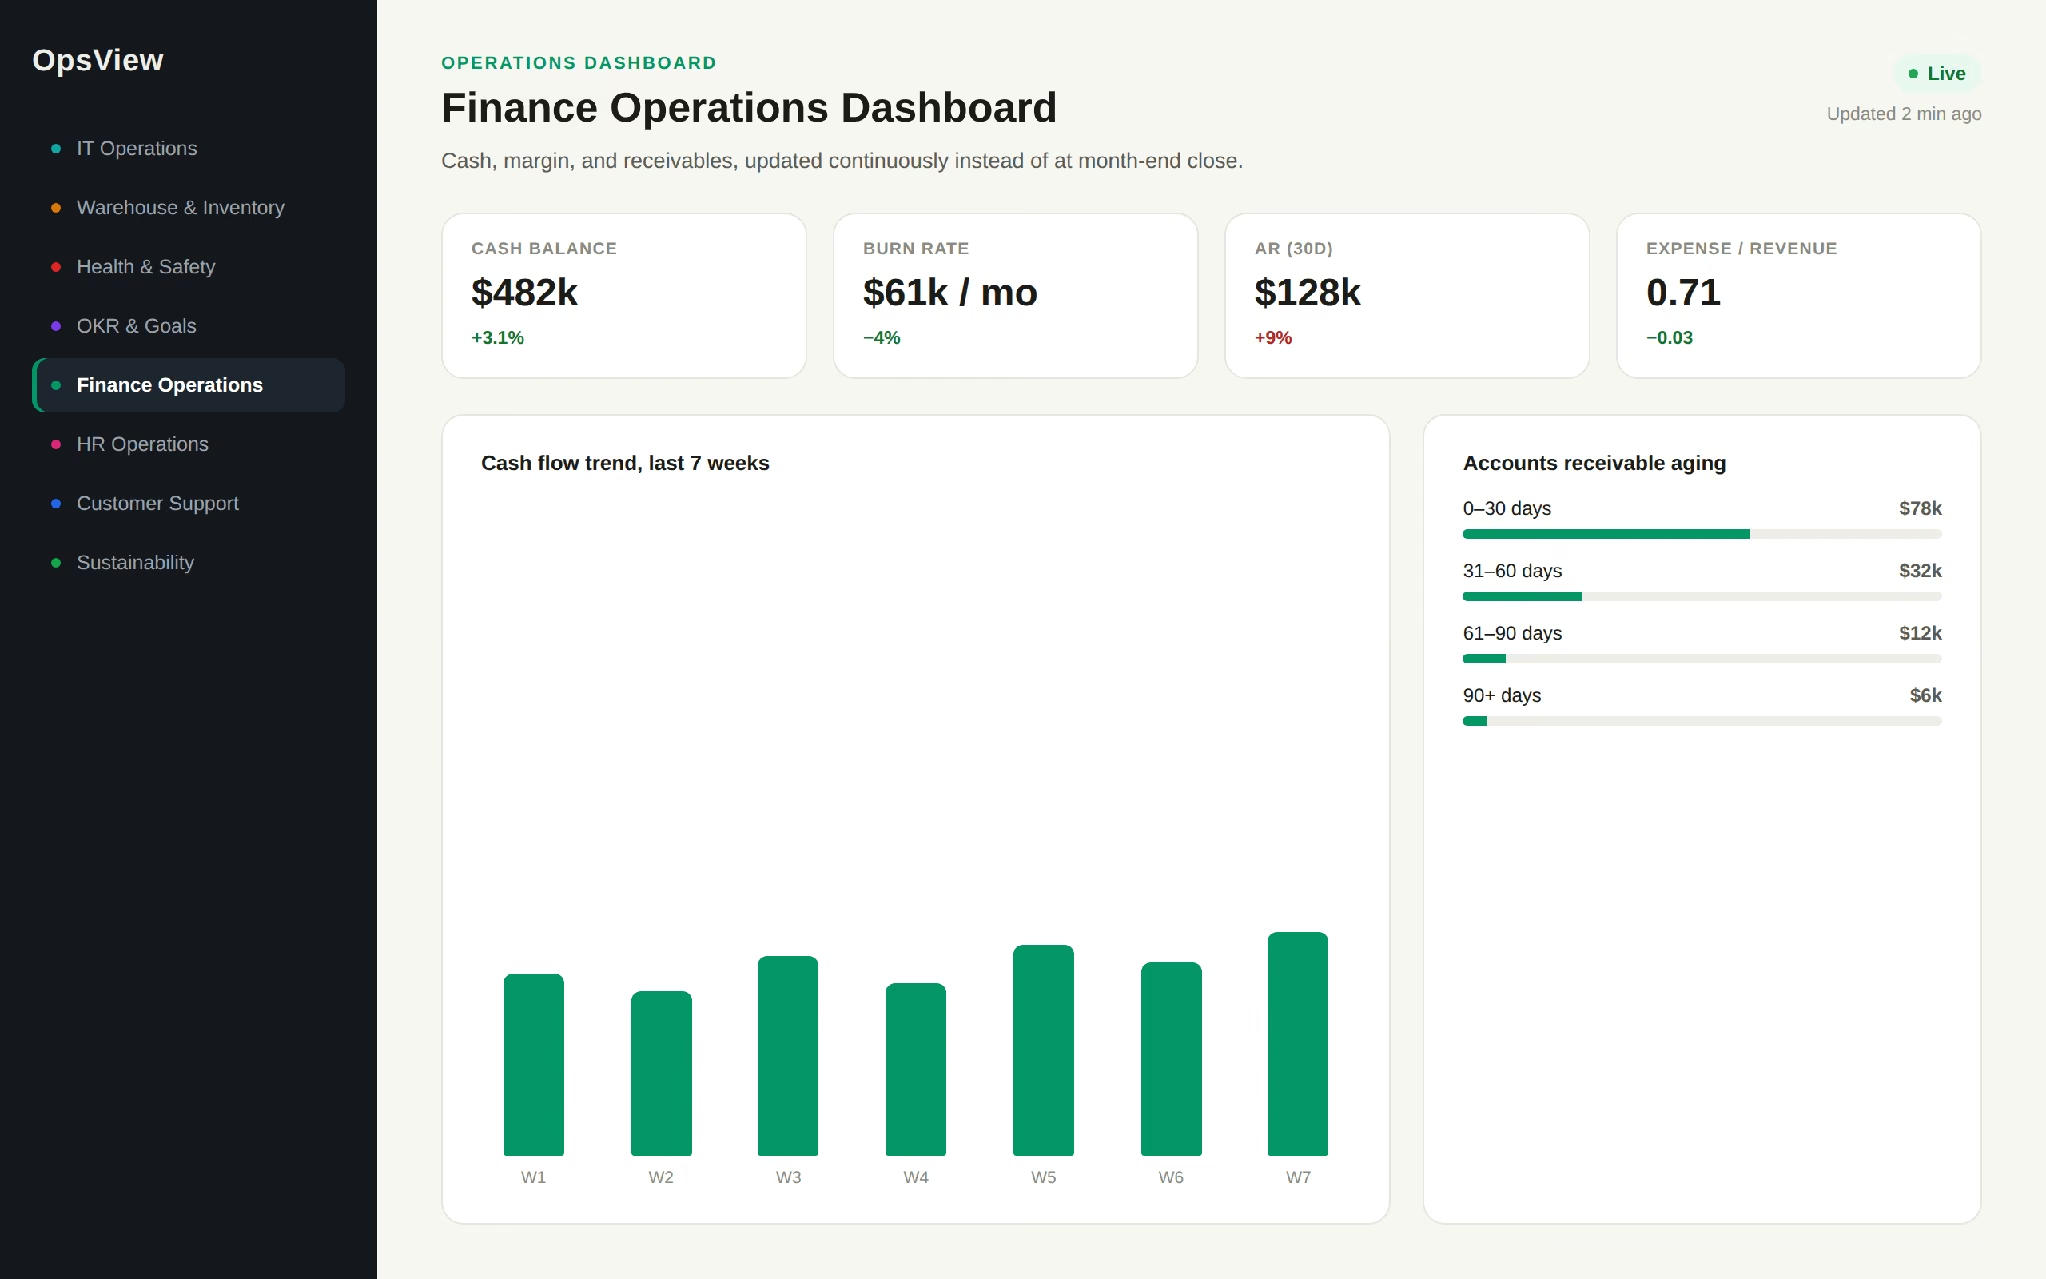
Shows the metrics that determine whether the business has the cash and margin to operate the way it plans to, updated continuously instead of at month-end close.
Common metrics:
- Cash flow and burn rate
- Accounts receivable and payable trends
- Expense-to-revenue ratio
- Working capital position
A finance team watching receivables trend upward in real time can start collections outreach before a liquidity gap actually opens up.
To track cash flow and receivables the same way, a financial dashboard builder lets you describe the numbers you watch and build the view around them.
HR Operations Dashboard
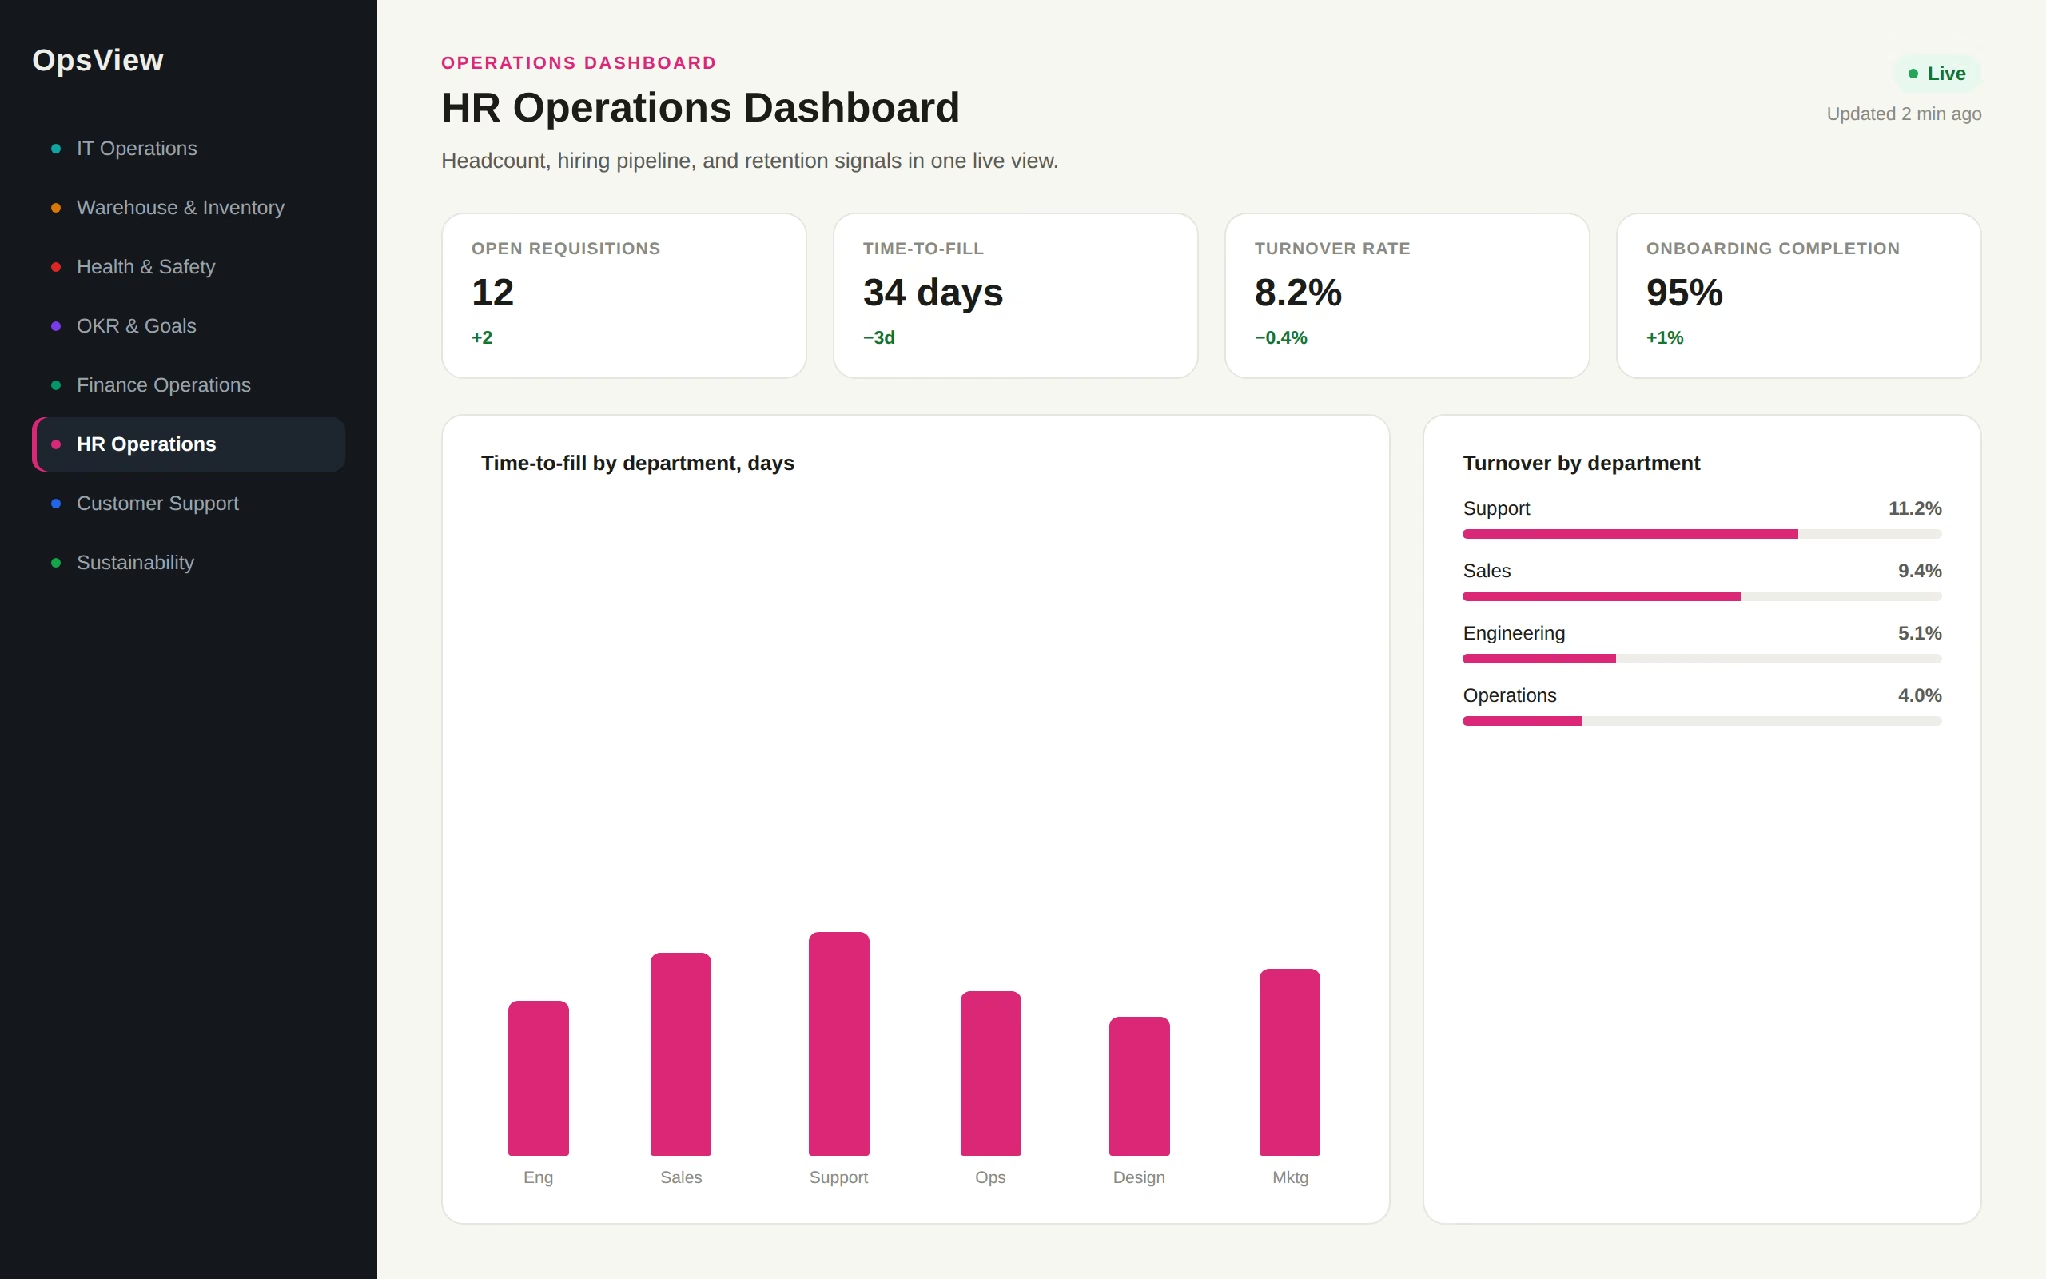
Gives people teams a live view of headcount, hiring pipeline, and retention signals instead of pulling a fresh report for every leadership request.
Common metrics:
- Open requisitions and time-to-fill
- Employee turnover rate by department
- Onboarding completion rate
- Engagement or eNPS trend
An HR lead tracking time-to-fill by department can flag a hiring bottleneck to leadership before it delays a product launch.
For a version built around your own hiring and retention numbers, an HR analytics dashboard builder can pull them into one live view.
Customer Support Operations Dashboard
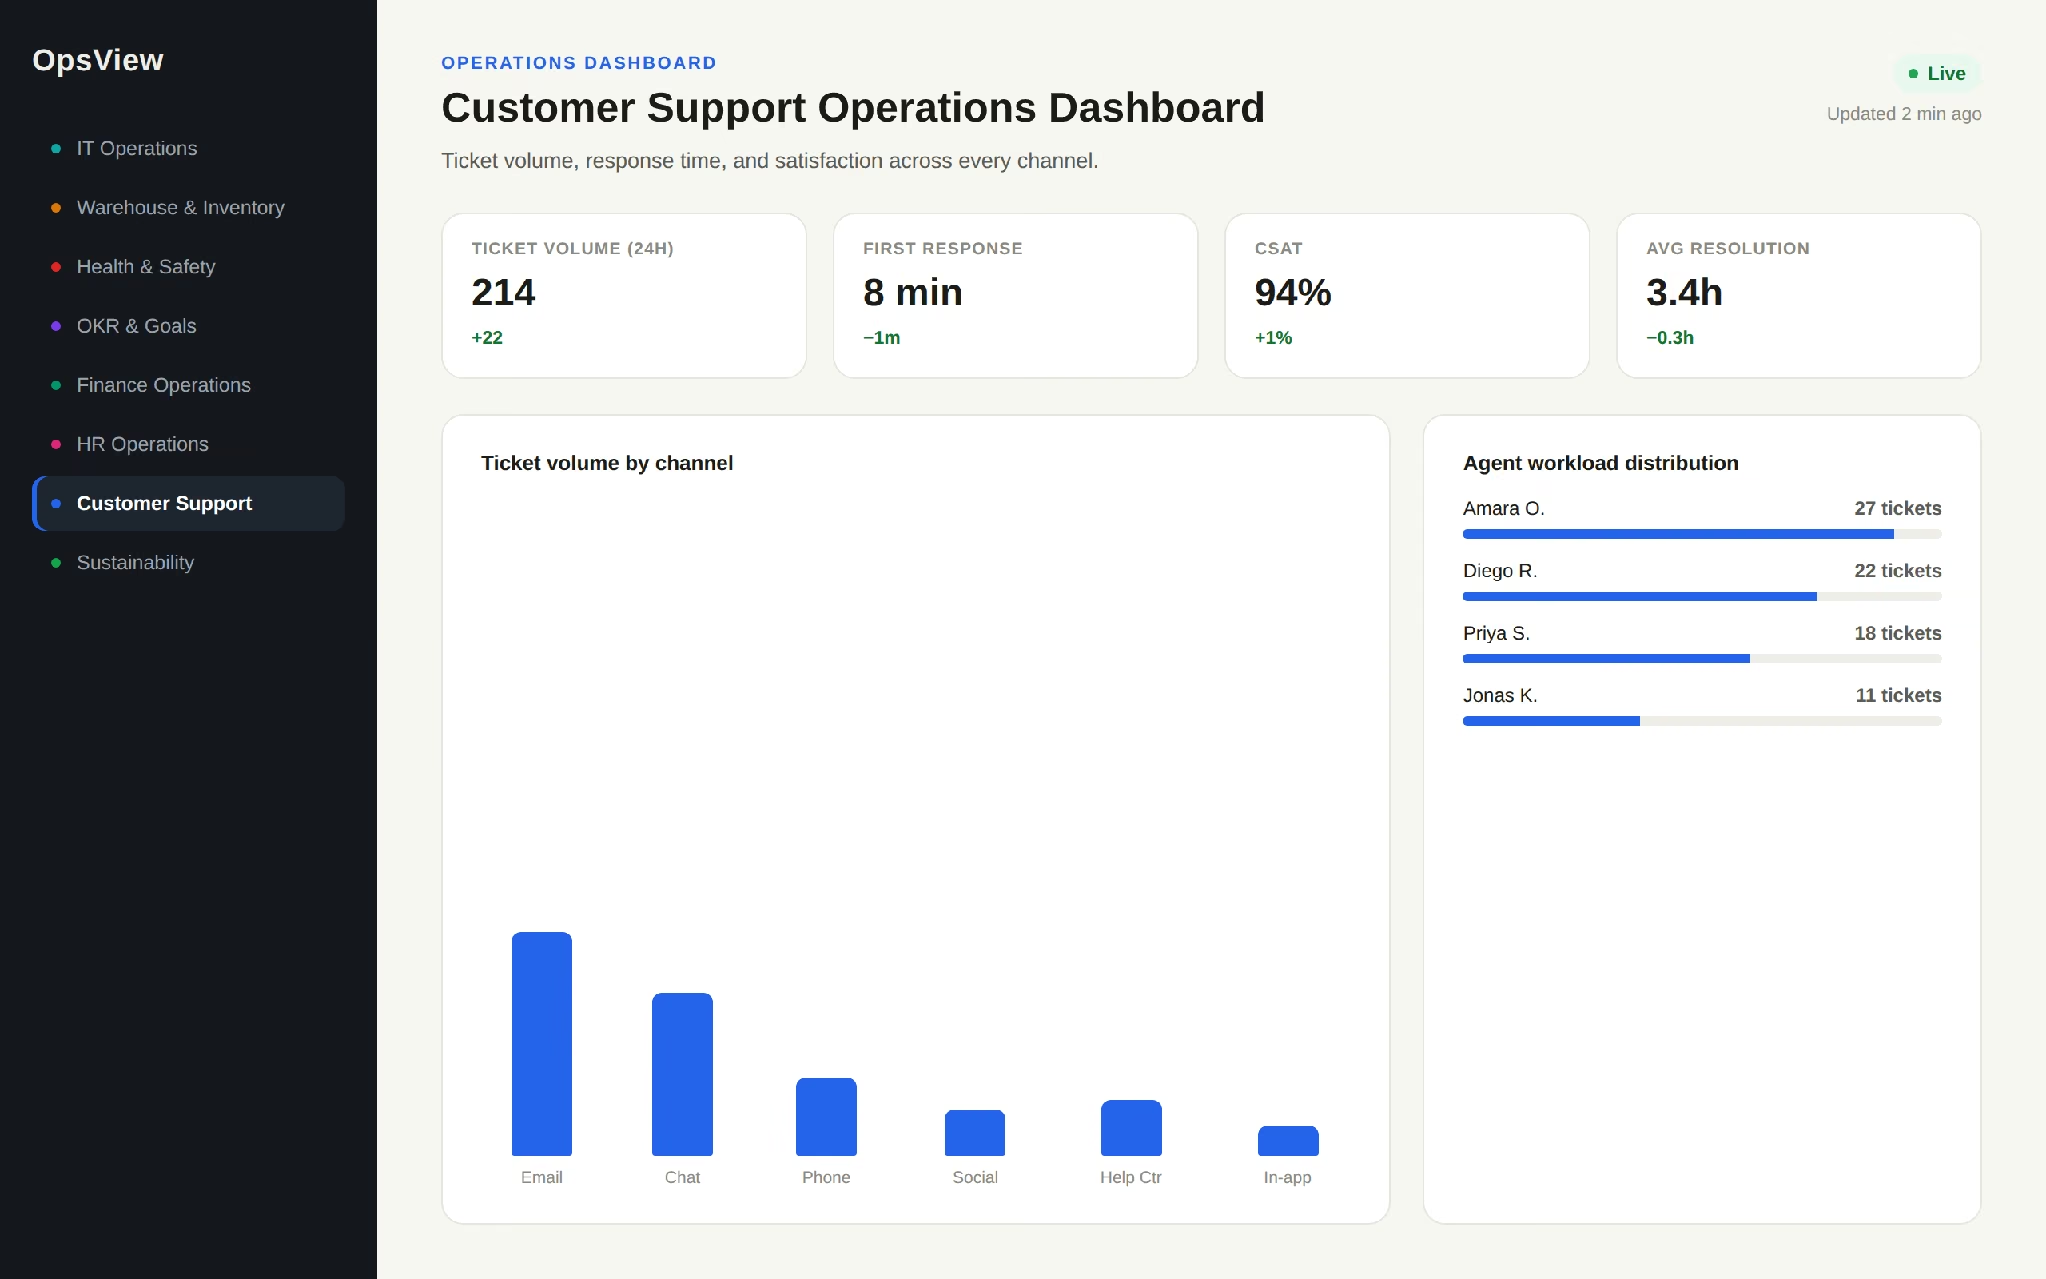
Tracks ticket volume, response time, and satisfaction across support channels, so managers can rebalance coverage before service slips.
Common metrics:
- Ticket volume by channel
- First response and resolution time
- CSAT score trend
- Agent workload distribution
A support manager seeing average response time creep up mid-shift can pull an agent from a lower-priority queue right then.
To build this view around your own channels and queues, a customer support dashboard builder lets you describe the metrics and get a working dashboard.
Sustainability Operations Dashboard
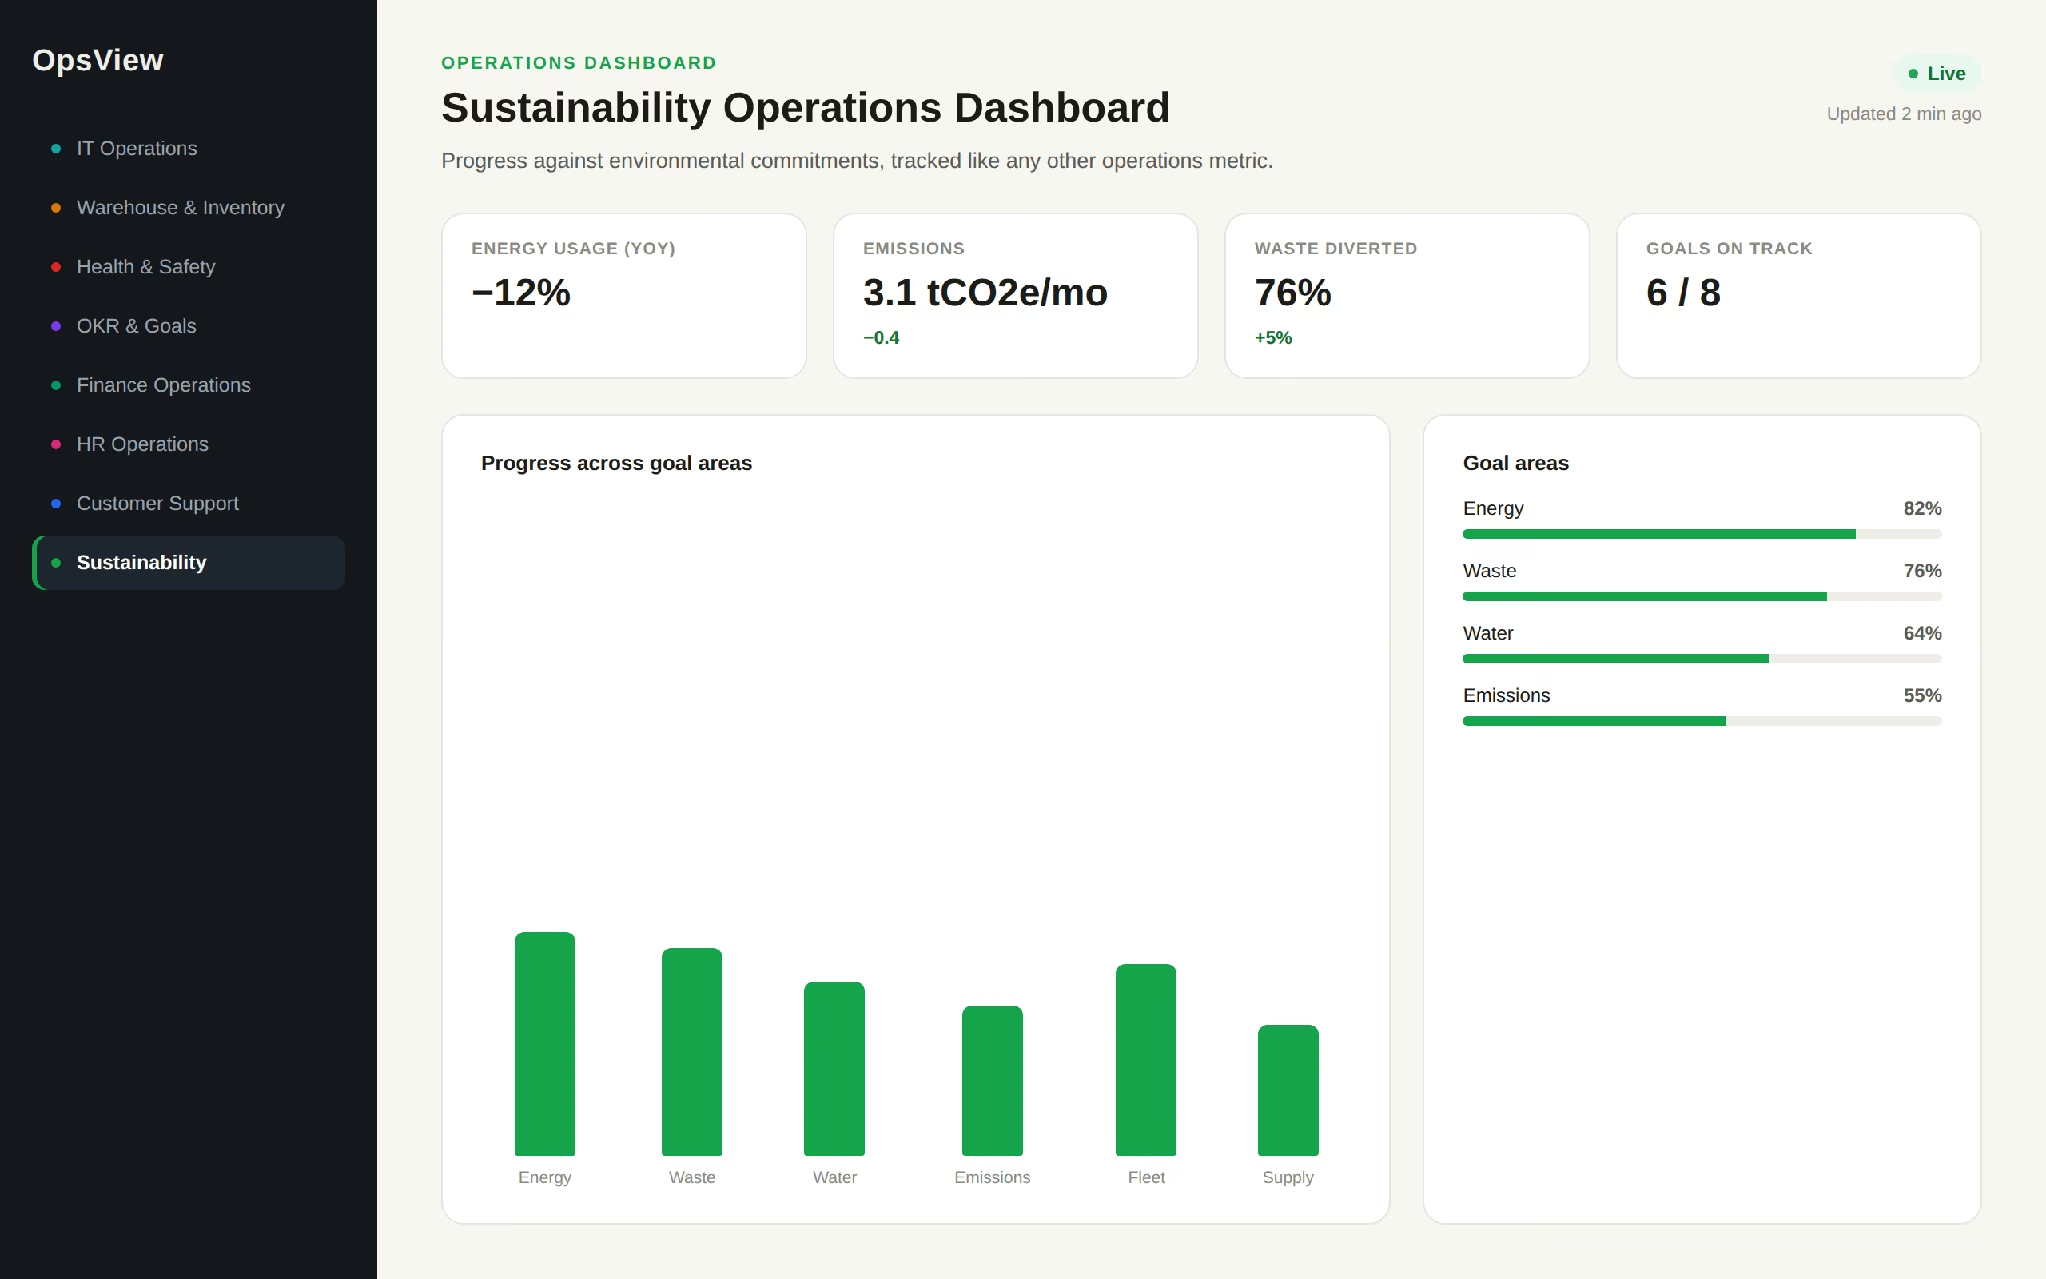
Tracks progress against environmental or ESG commitments using the same live-data approach as any other operations dashboard, rather than a static annual report.
Common metrics:
- Energy usage trend
- Progress toward stated sustainability goals, by area
- Waste and emissions metrics where tracked
A university tracking progress across eight sustainability goal areas on one screen can show stakeholders where things actually stand at any point in the year.
Why Operations Dashboards Get Abandoned After Launch
Every example above works when someone is actually looking at it. Most operations dashboards stop getting looked at within a few months, and it's rarely a technology problem.
According to Luzmo's 2025 report Dashboards: Dead, Dying, or Evolving?, 72% of users regularly abandon dashboards for spreadsheets. Those numbers hold up because the causes are structural.
The most common cause is metric overload. A dashboard built to answer every possible question ends up answering none of them clearly. If a viewer has to scan fifteen numbers to figure out whether anything needs attention, they'll stop checking.
A review of 75 studies found information overload is the most common dashboard problem, affecting nearly half of users. The dashboards that survive track five to ten metrics tied to specific decisions.
The second cause is silent data decay. A connected data source changes its export format, a connected login stops working, or a spreadsheet gets renamed, and the dashboard keeps displaying the last good numbers without flagging that anything is stale. Nobody notices until someone acts on a number that's three weeks old.
The third cause is that nobody owns it. A dashboard built during a project sprint often has no one responsible for updating it once priorities shift. Ownership needs to sit with a named person and be written into that person's job, or the dashboard quietly rots while still technically running.
The fix for all three is built into how you set the dashboard up: pick a small metric set tied to a real decision, set an explicit refresh check, and assign an owner while you're still building.
How to Build an Operations Dashboard
The build steps below fold in the causes of failure above, so the dashboard you launch is more likely to still be in use six months from now.
1. Pick the One Decision the Dashboard Needs to Drive
Before choosing a single metric, name the decision someone will make differently because of this dashboard: reorder stock sooner, reassign support coverage, flag a safety trend. A dashboard without a named decision behind it tends to accumulate metrics nobody acts on.
2. Choose 5 to 10 Metrics Tied to That Decision
Resist the instinct to include everything a data source makes available. Pick the smallest set of metrics that would actually change what someone does.
If you're not sure which numbers belong on a KPI dashboard, start from what metrics to track for your specific function rather than pulling every field a system offers.
3. Connect Your Real Data Sources
Most operations dashboards pull from more than one system: an ERP, a CRM, a spreadsheet, a ticketing tool. Connect the live source rather than a manually updated export wherever the tool supports it; every manual step is a place the dashboard can go stale without anyone noticing.
4. Design for Where It Will Actually Be Viewed
A dashboard displayed on a shared office screen needs large, glanceable numbers and almost no interaction. A dashboard opened individually by a manager can support more detail and drill-downs. Decide this before building the layout.
5. Set Thresholds for Each Metric
A raw number requires the viewer to know what's normal. A color-coded threshold (on track, at risk, needs attention) tells them immediately whether to act. This is the difference between a dashboard someone glances at and one someone actually uses.
6. Assign an Owner Before Launch
Name the person responsible for checking that data sources are still connected, and metrics are still relevant, and give them a set schedule. This single step prevents most of the silent decay described above.
If you're building this alongside a longer-range reporting view, see building an analytics dashboard for the trend-analysis side of this, distinct from the real-time operational view covered here.
How to Build an Operations Dashboard in Emergent
The steps above are easier to see applied to a real build. I used a fictional logistics company called RouteWorks, tracking fleet and warehouse performance across three regional hubs, keeping every prompt and every retry below.
If you're not sure how much detail a first prompt needs, Emmy, Emergent's free built-in assistant, turns a plain-language description into a build-ready prompt at no cost in credits.
Emergent also connects to Claude or ChatGPT over MCP for analysis against your live dashboard data.
Prompt 1: The First Build
“Build an operations dashboard for a logistics company called RouteWorks tracking on-time delivery rate, active fleet vehicles, warehouse order backlog, and driver utilization. Pull data from our order and fleet tracking spreadsheets.”

After I answered a few clarifying questions about the data source and design, Emergent returned a working dashboard with all four metrics laid out on one screen, pulling from the connected spreadsheets on the first attempt. The initial build took 11 minutes and consumed 15 credits.
Prompt 2: Connecting Live Data Instead of Static Uploads
“Replace the spreadsheet uploads with a live connection to our fleet tracking system, refreshing every 15 minutes instead of on manual upload.”

This step took about 15 minutes and 30 credits to complete, but the live connection worked correctly at the first pass, syncing at the stated interval.
Prompt 3: Drill-Downs by Regional Hub
“Let users filter the whole dashboard by regional hub: East, Central, and West, so a hub manager can see only their own numbers.”

The filter worked correctly on the first pass, and the dropdown auto-populated from the hub field already present in the fleet data; no follow-up prompt needed.
Prompt 4: A TV Display Mode for the Warehouse Floor
“Create a second, simplified view of this dashboard with larger text and no login required, meant to run on a TV screen in the warehouse. Keep the manager view as the detailed version.”
The simplified view came back correctly sized for a shared screen, but was initially still behind the same login as the manager view; a follow-up prompt asking for "a public read-only link that doesn't require sign-in" resolved it.
Prompt 5: An Ownership and Freshness Panel
“Add a small admin panel showing when each connected data source last successfully synced, and flag anything that hasn't updated in over 24 hours.”

The panel came back with sync timestamps for both connected sources and a red flag condition for anything stale, working as specified on the first attempt; no follow-up needed.
This step maps directly to the ownership problem described earlier: instead of assuming someone will notice a silent data gap, the dashboard now surfaces it.
This build consumed about 60 credits in total, above the 10 monthly credits included on the free plan, which also can't deploy.
The $20/month Standard tier includes 100 credits a month, enough to cover a build at this scope, but keeping the dashboard live draws a further 50 credits per month per deployed app, so budget for the hosting as well as the build. Total build time across all five prompts landed around 30 minutes.
Building Your Operations Dashboard with Emergent
Emergent's AI dashboard builder generates a working operations dashboard from a plain-language description, connecting to your existing data sources rather than starting from a blank chart.
For a general operations view across teams, start with the operational dashboard builder. For IT-specific tracking (uptime, tickets, and deployments), use the IT operations dashboard builder instead, since it's built around that function's specific metrics from the start.
If you're still comparing dashboard tools generally, this dashboard builder comparison covers how different platforms handle live data connections and layout flexibility.
One honest caveat: an AI-generated dashboard is a fast way to get a working operational view live, but if your team needs deep custom SQL modeling or a governed enterprise semantic layer across dozens of data sources, a dedicated BI platform built for that scale may still be the better starting point.
The steps above (five to ten metrics, thresholds, a named owner) apply regardless of which tool you build in.
Ready to see how hard your dashboard actually is to build? Describe it to Emergent and get a working first version back in minutes, free.
Describe it. Build it. Launch it.
- End-to-End Creation
- No Code Needed
- Live in Minutes
Most AI app builders stop at prototypes. Emergent creates production-ready apps you can actually launch.
- Production-ready apps
- Web & mobile apps
- Deploy in minutes