Build a Brand Perception Survey You Can Track Over Time
Build a brand perception survey that rates you against rivals each quarter and keeps every answer in a database you own.
Build a brand perception survey that rates my brand and two competitors each quarter and flags any drop.
Trusted by Builders Worldwide
Active Builders Worldwide
Apps Successfully Created
Countries Globally Reached



The Parts That Make Perception Data Comparable
Each piece keeps one wave's numbers readable next to the last.
Attribute statements on one fixed scale
Rate the brand on four to six statements, such as "Fees are fair" or "Easy to reach a person," each on a 1 to 5 scale. Locked wording keeps every wave in line with the last.
Competitors rated on the same statements
Ask the same statements about two or three competitors, shown in random order. Your score then reads against the market, and a rival the respondent has never heard of is skipped.
An open first-word question before any list
Ask for one word about the brand before any name or logo appears on screen. Theme rules you write group near-synonyms, such as cheap and affordable, and count each theme weekly.
Scores split by customer and non-customer
A screening question records whether each person bought from you this year. Every chart filters on it, plus region and age band, and segments under 50 answers are marked thin.
A message when an attribute slips
Set the drop that matters, such as half a point between waves. The brand lead then gets a Slack message or email naming the statement, both scores, and how the rivals moved.
Answers you keep, code you can export
Responses land in a database you own, one row per respondent per wave. Export the whole survey app to your GitHub repository on paid plans, then keep changing it with a prompt.
Four Perception Studies Worth Copying
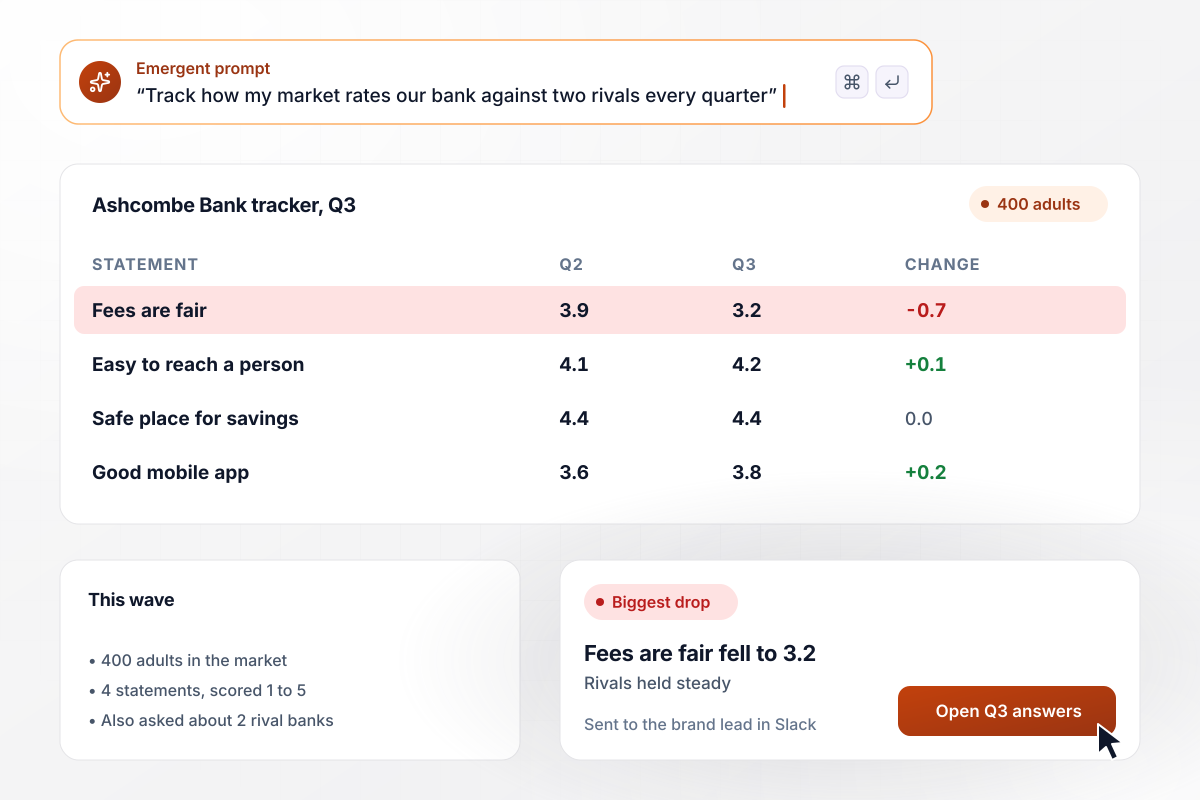
Four statements, two rivals, one quarterly score
Each quarter, 400 adults in a regional bank's market rate Ashcombe Bank on four statements, scored 1 to 5, then rate two rival banks on the same four. In Q3, "Fees are fair" fell to 3.2 from 3.9 while both rivals held steady, and the drop reached the brand lead in Slack.
window.awbMockup = { quarterlyTracker: "Build a quarterly brand perception tracker for my bank. Each wave, 400 adults in our market rate us on four statements from 1 to 5, such as fees are fair, then rate two rival banks on the same statements. Show each score next to last quarter with the change, and message our brand lead in Slack when any statement drops by half a point.", packRedesignTest: "Set up a split test for my pet food brand's new bag. Show each of 300 dog owners only one design, the current bag or the redesign, and ask them to pick every word that fits from a list of eight, like premium and natural. Chart the share picking each word for both designs side by side.", wordAssociations: "Before any rating question, ask small business owners for the first word they think of when they hear our payroll app's name. Let me write theme rules so pricey and costly count as one theme. Count answers per theme each month and post the tally to our brand research channel every Monday morning.", employerBrand: "Text every candidate two days after their final interview, hired or not, and ask whether they would tell a friend to apply, on a 1 to 5 scale. Save each answer with the role and the interview panel. Show me the average for hires and for people we turned down, by quarter." };
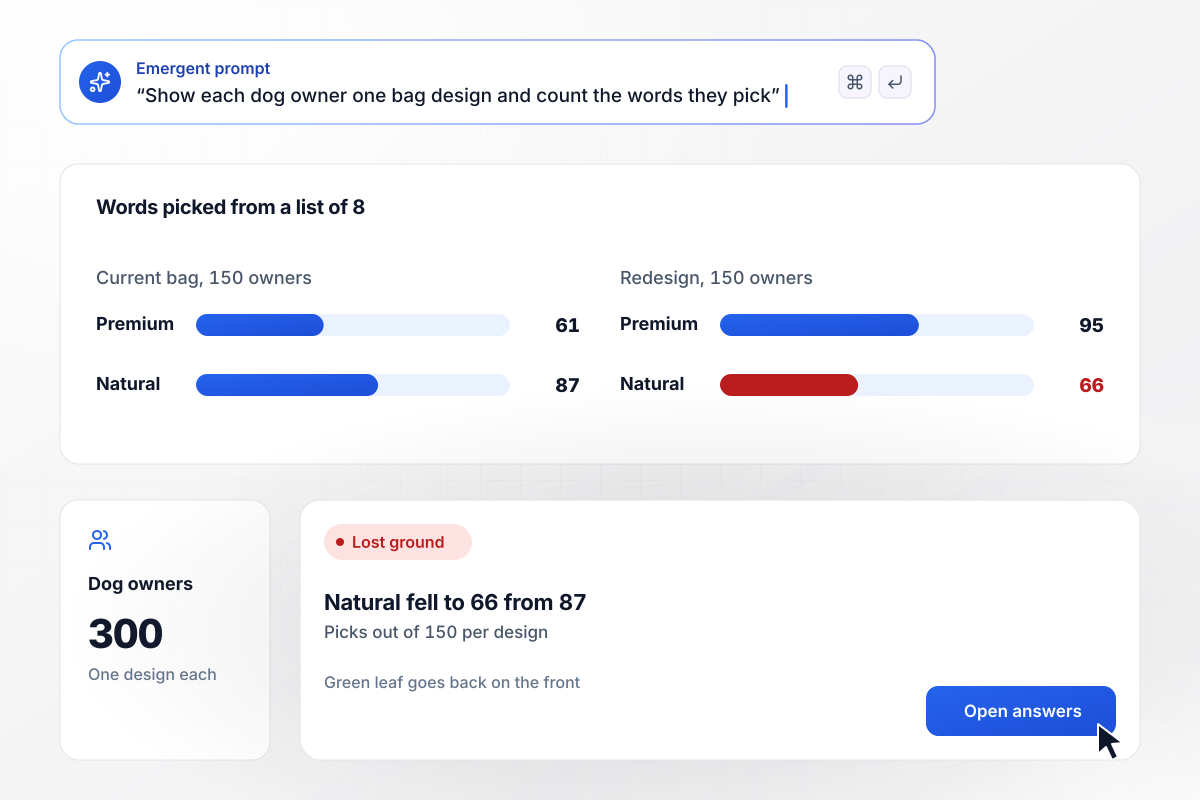
Old bag or new bag, never both
Before the new bag ships, 300 dog owners each see one design only and pick the words that fit from a list of eight. Of the 150 who saw the redesign, 95 picked premium, against 61 for the current bag. Natural slid to 66 from 87, and the design team put the green leaf back on the front.
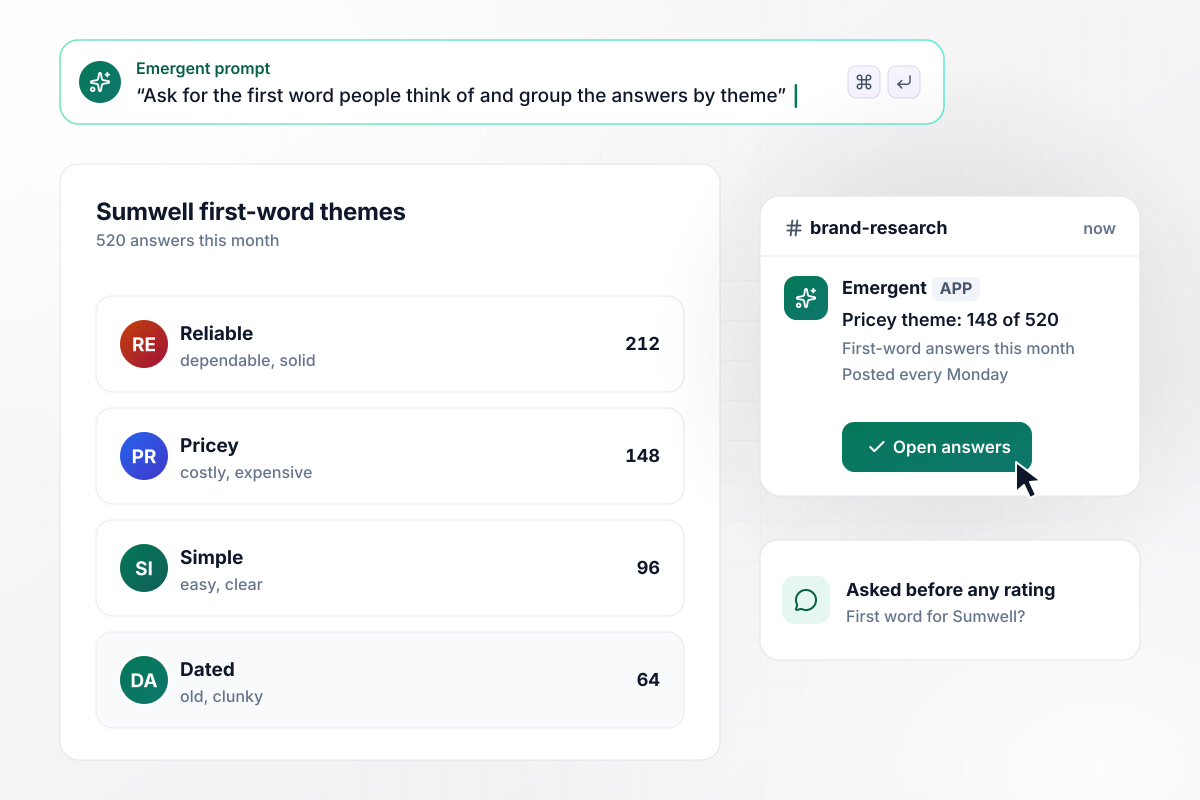
What one word says before the ratings start
Ahead of any rating question, small business owners type the first word that Sumwell, a payroll app, brings to mind. Theme rules count pricey and costly as one. This month, 148 of 520 answers landed in that theme, and the tally posts to the brand research channel every Monday.
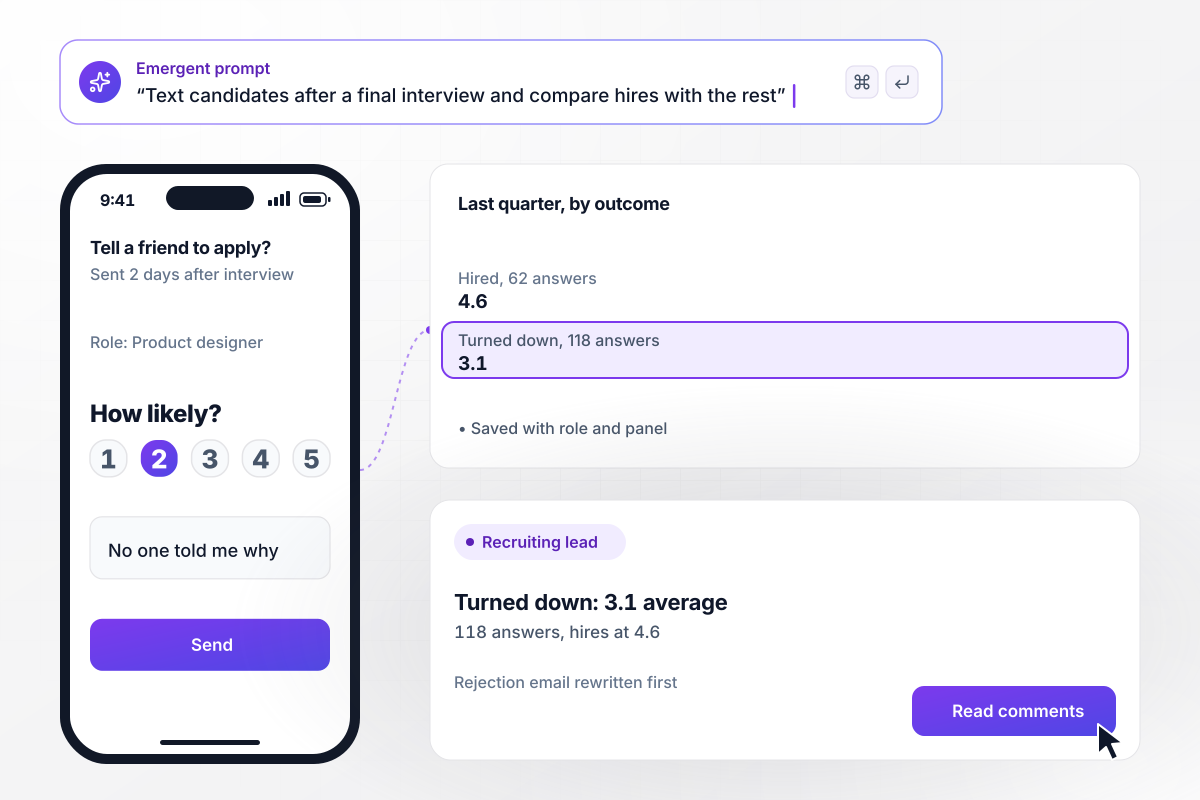
Candidates rate the employer, hired or not
Two days after a final interview, every candidate gets a text asking whether they would tell a friend to apply. Each answer is saved with the role and panel. Last quarter, the 118 people turned down averaged 3.1 against 4.6 for the 62 hires, and the recruiting lead rewrote the rejection email first.





How to Run a Brand Perception Survey
Seven steps to run a brand perception survey you can repeat each quarter and compare against rivals, then build it with Emergent.
Pick the group whose view you need, such as buyers in your category or customers who lapsed. Write one screening question for it, like a purchase in the past 12 months, and close the survey politely for anyone who does not qualify.
Before any brand name appears, ask what people think of when they hear your brand. Anyone shown a list first tends to pick from it instead of recalling, and the open answers lose their value. Keep this question on its own screen.
Draw the attributes from your positioning and from what buyers weigh when they choose, such as fair pricing or quick support. Phrase each one as a plain statement a person can agree with, and keep to one idea per line.
Repeat each statement for two or three competitors the respondent knows, in random order. A score of 3.8 means little alone. Next to a rival's 4.3, it tells you where you lose ground and by how much.
Keep the statements, the scale, and the sample size fixed, and field each wave in the same weeks of the quarter. A changed word or a holiday month can move a score more than anything the brand did between waves.
Split each score by customer and non-customer, then by region or age band where the sample allows. Treat any segment with fewer than 50 answers as directional, and label it that way on the chart you share.
Pick the statement with the biggest gap to the leading rival and change one thing behind it, like fee wording or support hours. Run the next wave unchanged and check whether that gap narrowed for the people it was meant to reach.
Why Build Your Perception Survey With Emergent?
Theme rules and alert thresholds are code you can read. Change them with a prompt, and keep adding waves with no cap on responses.

|
Attest | SurveyMonkey | Typeform | |
|---|---|---|---|---|
| How you build | Prompt for the survey, quiz, or poll and the app around it | AI co-pilot drafts it; its consumer panel answers | Templates and editor | Templates and editor, AI assist |
| Response limits | No response caps | Credits by tier, one per question answered | Response caps by plan | Monthly response caps by plan; the form stops at the cap |
| Behavior at cap | Keeps collecting, no cap | Top up credits mid-year, at a higher rate | Overage billed per extra response | Form stops collecting |
| Where responses live | A database table you own, plus any integration | Attest account | SurveyMonkey account | Typeform account |
| Code ownership | Full code export to GitHub on paid plans | None | None | None |


Pick the Pricing Plan That Works for You
Choose the plan that fits your building ambitions. From weekend projects to enterprise applications, we've got you covered.




Find the right survey, quiz, or poll
for your team




Frequently Asked Questions
Your Questions, Answered
Don't change this element unless you know what you are doing
More things you can build
with Emergent
on Emergent today