Build a Slider Scale Survey With Your Own Range and Labels
Build a slider scale survey people answer with one drag, and save each answer as a number in your own database.
Build a slider scale survey that asks my customers to rate the new checkout from 0 to 100.
Trusted by Builders Worldwide
Active Builders Worldwide
Apps Successfully Created
Countries Globally Reached



What Emergent Builds Into a Slider Survey
Each answer on a slider is a number. Emergent builds the track people drag and the table that adds those numbers up.
Range, step, and end labels you set
Tell Emergent the range and the step, such as 0 to 100 in steps of 5, and the words at each end. The slider snaps to those points, and a later prompt changes any of them.
A handle that waits to be moved
Ask for a handle that stays hidden until someone taps the track, so no answer starts at a default value. A slider nobody touched saves as blank, never as a quiet score of 50.
One slider per screen on a phone
Respondents see one question per screen and drag with a thumb, with the current value shown above the handle. The same survey opens on a laptop with the same steps and labels.
Each score kept as a plain number
Each answer lands as a number in its own column of a database you own, with the question and the time it arrived. Set this quarter's average beside last quarter's without retyping.
Averages and a low-score alert
The dashboard shows the average, the median, and the spread of scores for each slider. Set a floor, and the app sends an email or a Slack message when an average falls below it.
Code you can take with you
Every survey Emergent builds is code. On paid plans, export it to your GitHub repository with the slider settings, the scoring and the dashboard, and run the next round from there.
Four Teams Measuring on a Slider
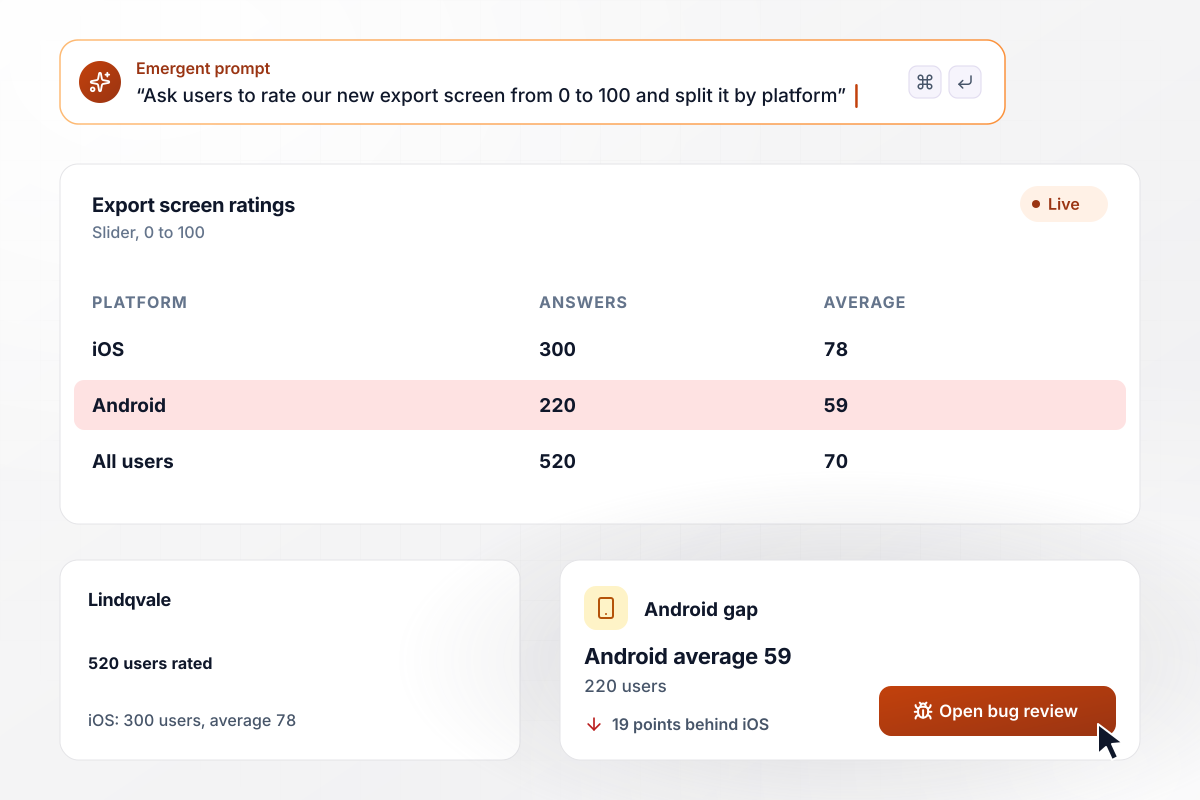
Android trails iOS by 19 points on export
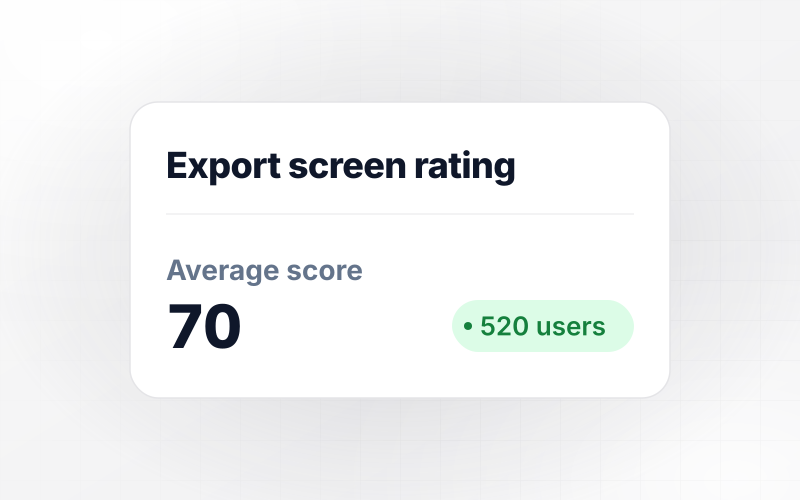
Lindqvale, a photo editing app, asks 520 users to rate its new export screen on a slider of 0 to 100. The overall average of 70 hides a split. The 300 iOS users average 78, the 220 on Android average 59, and the team opens a bug review for the Android export flow.
window.awbMockup = { productTeams: "Build a slider scale survey for my photo editing app. Ask users to rate the new export screen on a slider of 0 to 100, with Poor at the left end and Excellent at the right. Record whether each user is on iOS or Android, and show a dashboard with the overall average and the average for each platform, side by side.", hrTeams: "Every Friday, send each employee one question on a 0 to 10 slider: how manageable was this week's workload? Tag every answer with the employee's team. Show the average for each team on a dashboard, and when a team's average falls below 5, email that team's manager with the score, the team name, and the number of answers.", trainingWorkshops: "My college runs a spreadsheet workshop. Before it starts, attendees rate their confidence on a 1 to 10 slider on their phones, one question per screen. The same slider opens again at the end of the session. Show the class average before and after, and the change between them, on one dashboard.", priceTesting: "My meal kit company is adding a breakfast option. Ask subscribers what they would pay each month on a slider of $0 to $40 in $1 steps, with the handle hidden until they tap. Show the median answer and a bar chart of answers in price bands, such as $10 to $15." };
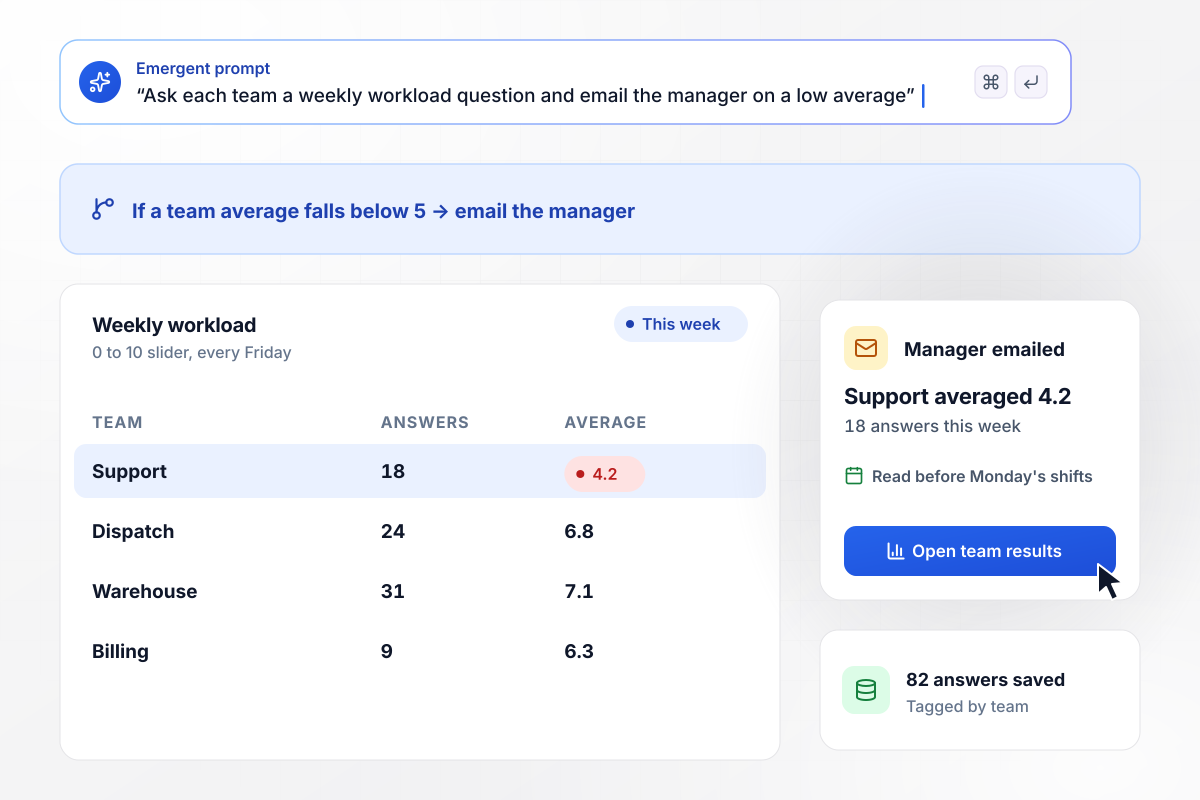
A team average under 5 emails its manager
Every Friday, Pebblecroft Freight asks each employee one question on a 0 to 10 slider: how manageable was this week's workload? When a team's average falls below 5, the app emails that team's manager. This week the 18 people on support averaged 4.2, and their manager saw it before Monday.
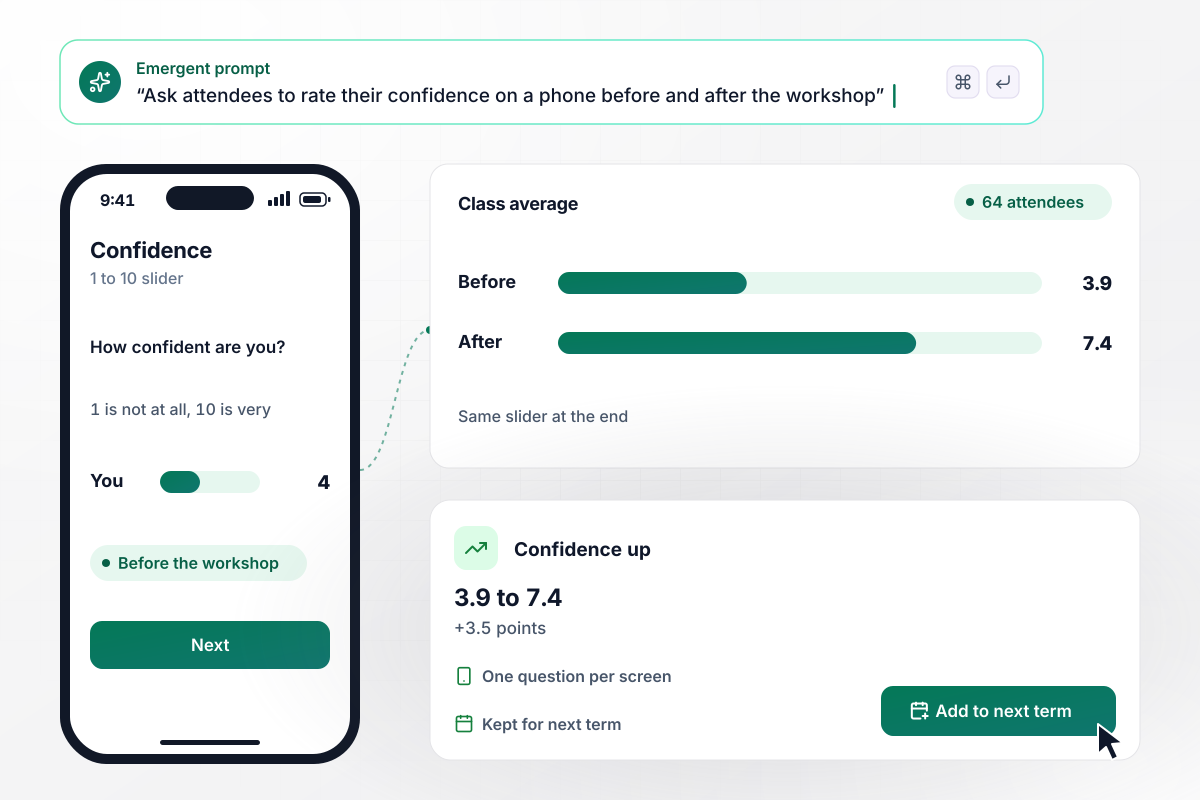
Confidence climbs 3.5 points in one workshop
Before the workshop starts, Wrexley Community College asks 64 attendees to rate their spreadsheet confidence on a 1 to 10 slider, one question per screen on their phones. The same slider opens again at the end. The class average moves from 3.9 to 7.4, and the college keeps the session on next term's schedule.
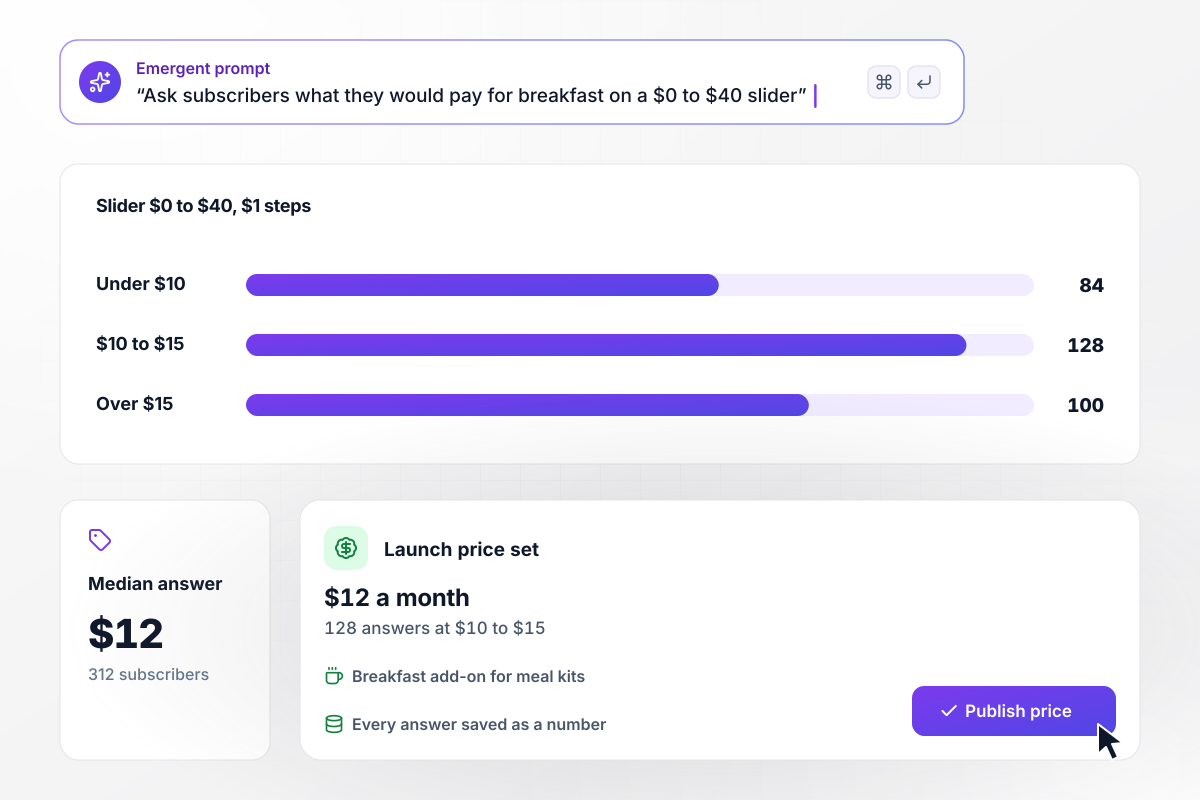
With a $40 ceiling, subscribers settle on $12
Dovecote Pantry wants a price for a breakfast add-on to its meal kits. It asks 312 subscribers what they would pay each month on a slider of $0 to $40 in $1 steps. The median answer is $12, and 128 answers fall between $10 and $15. The team launches the add-on at $12.






How to Create a Slider Scale Survey
Seven steps to create a slider scale survey with a range and labels people read the same way, then build it with Emergent.
Write down the one thing each slider measures, such as effort on a new screen or confidence with spreadsheets, and the words for each end. If an end label needs a full sentence, the slider is measuring two things. Split it into two questions.
Use 0 to 10 when people answer on gut feeling, and 0 to 100 when small differences matter, such as a before-and-after score. Set the step as well. A step of 5 on a 0 to 100 slider gives 21 points to land on.
Label both ends in words, and the midpoint too when the scale has a neutral center. Keep each label short enough to sit under the track on a phone, such as Not at all and Completely. Use the same labels on every slider that measures the same thing.
Start the handle hidden, or at the left end, rather than in the middle. A handle resting at 50 lets someone submit 50 without touching it. Ask for an untouched slider to save as blank, and skipped questions show up as gaps, not as scores.
Tell Emergent the questions, the range, the step, the end labels, and where the handle starts, in plain sentences. Emergent builds the survey, the database table behind it, and the dashboard. Change any of those settings later with another prompt.
Send the survey to five people and watch them answer on their phones. Check that the handle is easy to grab, that the value shows while they drag, and that each answer lands in the table as the exact number they picked.
Read the median and the spread next to the average. An average of 50 can mean everyone sat near the middle, or that half the group said 10 and half said 90. Split the results by the field that matters, such as platform or team.
Why Build a Slider Scale Survey With Emergent?
Scores arrive as plain numbers in a database you own, and Emergent puts no cap on how many people answer each slider.

|
SurveyMonkey | Microsoft Forms | SurveyHero | |
|---|---|---|---|---|
| What you get | Survey, logic, and response database, as code you own | Survey builder with templates, including employee engagement | Surveys, quizzes, and polls with response summaries | Survey builder with templates, including employee satisfaction |
| Pricing model | Credits, no response caps or per-response fees | Per-user team plans with a seat minimum, billed annually | Free with a Microsoft account; included in Microsoft work and school subscriptions | Free plan, then per-account plans with unlimited responses |
| Where responses live | A database table you own, plus any integration | SurveyMonkey account | Microsoft Forms, with export to Excel | SurveyHero account, EU data centers |
| Code ownership | Full code export to GitHub on paid plans | None | None | None |




Pick the Pricing Plan That Works for You
Choose the plan that fits your building ambitions. From weekend projects to enterprise applications, we've got you covered.




Find the right survey, quiz, or poll
for your team


Frequently Asked Questions
Your Questions, Answered
Don't change this element unless you know what you are doing
More things you can build
with Emergent




on Emergent today